Automatic Voter Registration (AVR) is a commonsense way to modernize the voter registration process, keep voter registration rolls up-to-date and secure, and remove obstacles to voter participation.1 And it is simple. When a state has confirmation of a person’s eligibility to vote, it automatically registers that person to vote, unless they decline.2
Low voter participation is a problem in a democracy, where individuals make choices about the future of their towns, cities, states, and country by exercising their voting power at the polls. The current system of voter registration—which puts the burden on individuals to get and stay registered—is an unnecessary barrier to voter participation.3 Democracy works best when eligible voters have their voices heard, and state and federal policies should support that.4
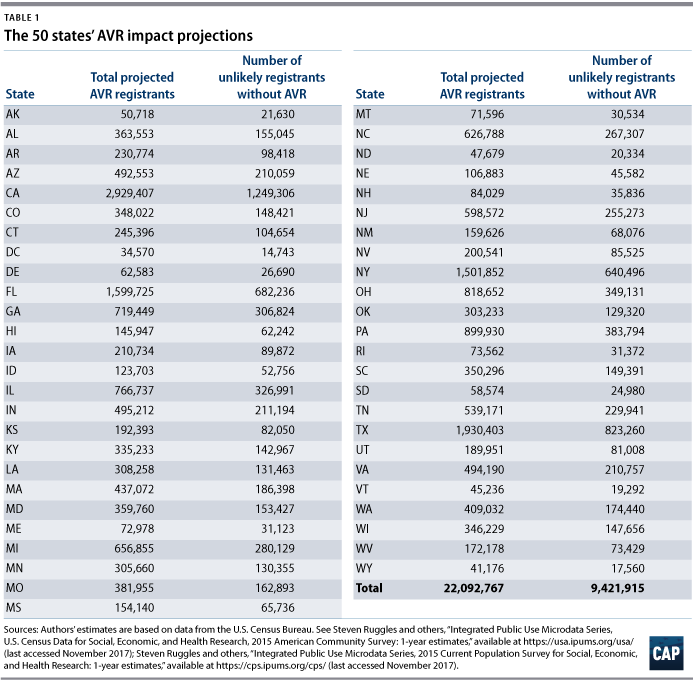
The Center for American Progress projects that if every state adopted Automatic Voter Registration like the effective system used in Oregon, more than 22 million people across the country would join the voter rolls in the first year of the program alone. These new voters would then be poised to participate in making America’s political decisions.5 Of those 22 million new voters, almost 9.5 million are unlikely to have become registered without the convenience of AVR.6
Oregon was the first state in the country to use AVR, with great success. Last year, in the first year of the program, more than 272,000 new people were added to the state’s voter rolls, and more than 98,000 of them voted in the 2016 election.7 They became registered as a result of interacting with Oregon’s Department of Motor Vehicles, or OMV, such as when they went to get a driver’s license. More than 116,000 people registered who were unlikely to have done so otherwise; more than 40,000 of these previously disengaged people voted in the November 2016 election.8 Oregon’s electorate is now more representative of the state’s population since citizens registered through AVR are younger and live in places that are less urban, lower-income, and more ethnically diverse.9
Importantly, an additional 570,000 Oregonians had their voter registration records updated when they submitted a change of address through the OMV.10 This helps keep the voter registration lists up-to-date and more accurate, and protects the integrity of elections while ensuring more Americans can have their voices heard and exercise their power at the polls.
While voter registration does not guarantee voter participation, CAP estimates that about 87 percent of people who were registered to vote reported voting in both 2012 and 2016. It is instructive to compare the relatively small vote differential between winning and losing candidates to the number of new registrants projected to be added in each state in just the first year with AVR. For context, this brief looks at the 10 closest 2017 Virginia House of Delegate elections and the 25 closest congressional elections for the House of Representatives in 2016 and compares the currently missing voices who could be brought into political decision-making with AVR.
Using AVR can also save states and localities significant costs from transitioning away from paper-based voter registration records. AVR is the next logical step in creating an efficient, secure, and modern voter registration system for the 21st century.11
Fifty-state AVR impact projections
In addition to Oregon, some form of AVR has already been adopted in 9 states and Washington, D.C.12 In Illinois, it was passed unanimously by the legislature and signed by Republican Gov. Bruce Rauner;13 in Alaska, it was adopted by voters at the ballot.14 California is scheduled to launch their program in April 2018.15 It is important to note that not all AVR systems are using Oregon’s effective policy design, which relies on a no-action default to voter registration for eligible citizens; social science demonstrates this is the best way to achieve a favored outcome.16 The impact on increasing the number of people that become and remain registered to vote will vary depending on inclusiveness of the AVR policy adopted.
Table 1 uses estimates of AVR’s impact in Oregon to project how many new potential voters would be added per state if every state were to adopt a similar AVR system. CAP’s analysis also shows the subset of how many people in each state are likely not to have become registered to vote without AVR.
Increasing access to the ballot is particularly important at a time when participation rates are low and critical choices are being made for society’s future.17 Elections in many states are very close, with margins of victory less than 5 percent,18 and yet across the country tens of millions of eligible but unregistered citizens are not pulling the levers of power by casting their votes.19
Close elections, missing voices: Virginia
The election results in the November 2017 Virginia House of Delegates races are illustrative of the power of even a small number of voters to determine election outcomes.20 The five closest contests in Virginia have candidates whose vote totals are separated by less than 1 percent;21 four of those races currently each have fewer than 130 votes dividing the candidates.22
If Virginia were to implement AVR, the commonwealth would be projected to add nearly half a million voter registrations, 210,000 of whom are people who are unlikely to have become registered to vote without AVR.23 If Virginia’s 494,190 projected AVR registrants were distributed evenly in the state, each of the 100 delegate districts would have nearly 5,000 new potential voters.24
That number of new people who would be registered to vote is more than four times the largest margin of victory in Virginia’s 10 closest Delegate races25 and more than 12.5 times the margin of victory in the closest six Delegate races.26

Close elections, missing voices: Congress
The balance of power at the federal level also rests on a few close races. In 2016, 16 congressional seats were won with a victory margin of less than 5 percent of the votes cast.27 In seven races, that meant fewer than 5,000 votes between the winning and losing candidates.28 An additional nine seats were won with a victory margin of between 5 percent and 7.6 percent of votes cast.29 Of the 25 closest races, the largest margin of victory between winning and losing candidates was fewer than 27,700 votes; the closest 21 House seats were won with a margin of victory of fewer than 20,000 votes.30
The number of voter registrations per congressional district dwarf the margins of victory between the winning and losing candidates—the ratios range from almost twice as many to 24 times as many people newly registered to vote compared to the number of votes that determined the election.31 While these AVR impact projections do not attempt to predict where the projected potential voters newly registered through AVR live, CAP has divided the statewide projected AVR registrants by the number of congressional districts in the state to give a rough sense of AVR’s potential to bring more voices into the process of making collective political decisions:
- In the six closest elections, the number of projected new voter registrants are in double digits compared to the margin of victory; they range from 10 times to 34 times the margin of victory between the winning and losing candidates.32
- In an additional seven races, the number of new registrants would be between 2 and 3 times the margin of victory between the winning and losing candidates.33
- In just two of the closest elections, the new voter registrants per district are slightly less than twice as much as the margin of victory between the winning and losing candidates.34

AVR is a secure, modern process that strengthens America’s democracy by expanding and broadening the electorate.35 Americans deserve to have the roadblocks to participation removed so we can revitalize the fundamentals of self-government.36
Methodology
The estimates reported here are derived from a variety of data sources and models. To start, we developed estimates of each state’s eligible voter population using the 2015 1-Year American Communities Survey.37 We broke the population in each of these states into 160 groups based on race, age, income, and education.
From there, we estimated the registration rates for each of these 160 groups in all 50 states and Washington, D.C., using data from the 2016 November Supplement of the Current Population Survey. These rates were produced using cross-nested multilevel models that estimated the registration rate for each state, race, age, income, and education level group represented in the data. Many of these groups can be very small, but this approach provides more realistic starting estimates of registration for low-sample populations by partially pooling data across individuals’ geographic and demographic characteristics. We applied those registration rates to the eligible voter population counts in each to generate counts of the registered and unregistered populations in each state.
Using data from our original analysis of automatic voter registration in Oregon,38 we derived two important values that allowed us to map what we saw occur in Oregon in 2016 onto other states. First, what percentage of the unregistered population passed through Oregon’s OMV system in 2016? To estimate this, we took the number of people who were registered by the OMV system in Oregon (about 270,000) and divided it by the estimated number of unregistered voters in Oregon from our model above plus the number of people who were registered by the OMV system.39
Second, what percent of those who passed through OMV were unlikely to have registered themselves? This was derived by taking our original estimate of the number of OMV registrants who were unlikely to have registered themselves (about 116,000) and dividing by the total number of people registered by OMV in 2016. As we described them in the original report, these “unlikely registrants” had the following characteristics in Oregon:40
- They were not registered during the 2008, 2010, 2012, or 2014 elections.
- They were old enough that they could have been registered and voted since 2008.
- They did not take any action in order to become registered (in this case, returning a registration postcard).
With those two values in hand, we simply apply those rates to the estimated number of unregistered voters in each state to derive a) the total number of individuals we believe would pass through an AVR system in a given state as well as b) the number of those individuals who we believe would not have registered on their own. Applying these rates to other states is a simplification—in reality, the rates would vary dependent on the type of AVR system a state instituted, the demographic composition of the state, behavioral differences between state populations, etc.—but gives us a baseline to think through what the potential effects of this law might be in other states.
Liz Kennedy is the director of Democracy and Government Reform at American Progress. Robert Griffin is the director of quantitative analysis for Progressive Studies at American Progress. Special assistant Gwen Calais-Haase provided research support.