See also: Interactive Map: The Uneven Housing Recovery by Michela Zonta, Sarah Edelman, and Andrew Lomax
The Great Recession, which began with the collapse of U.S. home prices in 2007, resulted in an enormous number of households with negative equity. Housing prices dropped nationally by 35 percent during the collapse. As home values fell, the mortgage debt obligations of millions of American homeowners remained fixed, leading to an unprecedented number of homes being worth less money than what was owed on them.
Seven years later, about 7.5 million American homeowners are still underwater. Even though home values have continued to rise and the national percentage of homeowners with negative equity is down from 30 percent in the second quarter of 2011 to 15 percent in the first quarter of 2015, there is still much work to be done in order for the market to fully recover.
Negative equity is considered one of the principal challenges to an economic recovery at both the local and national levels.2 The persistence of negative equity imposes significant costs not only on homeowners but also on local communities and the economy at large. When homeowners owe more on their homes than what they are worth, they are unable to draw on home equity to invest in their children’s education or to start small businesses. Homeowners also may curtail their consumption by purchasing fewer goods and services from local businesses, thus curbing employment and income levels. Finally, because of underwater borrowers’ high propensity to default, large concentrations of underwater properties threaten to induce future waves of foreclosures and can contribute to a continuing cycle of decline and disinvestment.
The mortgage crisis has affected the entire nation and economy. It is important, however, to recognize that the negative equity crisis has tended to be concentrated in certain areas of the country, and its evolution has followed different patterns based on geography. This report examines the course of negative equity at the county level nationwide and provides an account of the characteristics of counties that have experienced a decrease in the incidence of negative equity compared with those where negative equity rates are stagnating or getting worse.
The following key findings are based on the analysis presented in this report:
- The negative equity crisis is a dynamic phenomenon, as it varies in magnitude and impact over time.
- Not all counties are recovering. Close to 1,000 counties across the country present either stagnating or increasing percentages of underwater homes. Among counties that are improving, many continue to experience above average rates of negative equity.
- Struggling counties tend to be located in nonmetropolitan and rural areas. Counties that are experiencing an increase in negative equity rates tend to be located in nonmetropolitan and rural areas, which are less likely to be equipped with the resources that could ease the recovery.
- Trends in negative equity are consistent with trends in other socioeconomic indicators. Changes in negative equity rates are significantly correlated with variations in household formation, job growth, and income levels.
- Renter affordability is a growing problem across the board. It is a growing problem for the large majority of counties as a result of the pressure on the rental market generated by the foreclosure crisis.
In light of these findings, policymakers should consider these actionable steps to help the counties that are still far from a full recovery:
- The Federal Housing Finance Agency, or FHFA, and the Federal Housing Administration, or FHA, should promote neighborhood stabilization efforts and foreclosure prevention.
- Congress should support the development of affordable rental housing programs that provide local governments with sufficient resources to help meet local rental affordability challenges.
- Policymakers should implement specific policy interventions for the revitalization of rural areas experiencing increases in negative equity.
- More negative equity data need to be made available in order to identify and monitor local markets that are economically stagnant and still present high levels of negative equity.
The negative equity crisis has improved since 2011. Millions of households, however, are still underwater, and as a result, the communities in which they live are still a long way from a full housing and economic recovery. This report illustrates the dynamic nature of the negative equity crisis and its strong ties to local economies and concludes with some policy recommendations that could help ease the impact of the negative equity crisis on not only local communities but also the economy at large.
A note on county-level data
The availability of historical data on negative equity and of other socio-economic and housing indicators at the national level allows for a comprehensive longitudinal analysis of negative equity and its correlates. The analysis focuses on multiple years, including those preceding and following the financial collapse. Most analyses so far have focused on static portraits of negative equity by concentrating on data for one specific point in time or for specific localities. As this report illustrates, the negative equity crisis has been dynamic, especially from a geographic perspective. By looking at trends over time, it is possible to understand and predict the housing and economic trajectory in counties experiencing different levels and patterns of negative equity. In addition, by utilizing counties as the unit of analysis, it is possible to better gauge the relationships between negative equity and regional economies and housing markets.
For instance, as a Washington Post article published earlier this year illustrated, Prince George’s County, Maryland, still features high rates of negative equity and serious delinquency rates that make the housing and economic recoveries of its neighborhoods seem remote. A closer look at trends over time and job market indicators, however, shows that unlike many counties with serious negative equity challenges, Prince George’s County’s economy and housing market are slowly and steadily improving. While the housing market is still fairly distressed in Prince George’s County, there are reasons to be hopeful that positive trends will continue. In particular, the county’s close proximity to Washington, D.C., should continue to provide greater access to jobs to county residents, as well as attract new residents.
As with any analysis of aggregate data, the analysis of negative equity at the county level may fail to reveal important intracounty variations. Several counties feature various promising patterns of economic and housing recovery. Yet many are characterized by substantial variations in negative equity at a more granular level, as ZIP code data suggest. Therefore, it is important to keep in mind that the analysis presented here is not intended to lead to conclusions related to areas smaller than the county.
Another potential shortcoming is related to causation. The analysis explores several correlations among real estate and business cycle indicators. Although a longitudinal analysis of these correlations may hint to possible causal relationships, this study is not intended to make inferences about causation, as more information, including historical data on foreclosures and delinquencies and on local regulatory environments, would be needed to explore statistically any causal relationship between negative equity and housing and economic recovery.
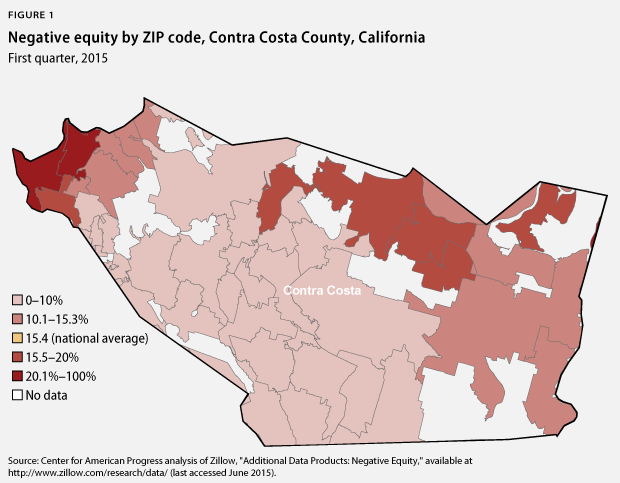
An example of intracountry variation
Although negative equity tends to be concentrated in particular counties, the distribution of negative equity by ZIP code reveals important variations within counties that are not captured by aggregate data. For instance, although the negative equity of Contra Costa County, California, is 9.8 percent in 2015 and has declined from 38.6 percent in 2011, there are considerable variations in the incidence of underwater homes in the county across ZIP code areas. For instance, the ZIP codes located in the northwestern part of the county still present high negative equity rates. These include Richmond, California, where the negative equity rate in the first quarter of 2015 was 16.2 percent. (see Figure below)
Michela Zonta is a Senior Policy Analyst for the Housing Policy team at the Center for American Progress. Sarah Edelman is the Director of Housing Policy at the Center.