This report contains a correction.
Introduction and summary
For more than a century, the United States has been a global leader in conservation. In 1872, it became the first country to establish and protect a national park—Yellowstone—for the benefit and enjoyment of the public.1 Though radical at the time, the idea of conserving nature through the creation of protected areas has become the most powerful, effective, and flexible tool of American conservation policy. To date, this strategy has protected millions of acres, emerged as a point of national pride, and made the United States a global role model for conservation.2
Unfortunately, the United States is now retreating from its position as a global conservation leader. In December 2017, President Donald Trump announced the elimination of protections for large portions of two national monuments in Utah: Grand Staircase-Escalante and Bears Ears. This action, though likely to be overturned in court, was the largest reduction in land protections in the country’s history.3 Soon after, Congress ordered that the coastal plain of Alaska’s pristine Arctic National Wildlife Refuge be auctioned off for oil and gas drilling for the first time in its 40-year history.4 Weeks later, in January 2018, Secretary of the Interior Ryan Zinke approved a plan to build a road straight through the previously wild Izembek National Wildlife Refuge, also located in Alaska.5 Altogether, these actions have eliminated protections for more than 3 million acres of previously conserved lands—an area 1.5 times the size of Yellowstone National Park.
Outside of the United States, however, conservation has been on a growth trajectory, including to the immediate north and south of U.S. borders. Both Canada and Mexico have designated major new reserves and expanded existing areas, significantly increasing the extent of their protected area systems. Both countries have also announced ambitious plans to invest in further expansions of protected areas.6
The role reversal between the United States and its neighbors, Canada and Mexico, is occurring during a pivotal moment in the history of conservation. Scientists agree that species extinctions are occurring at a rate that is 100 to 1,000 times faster than before humans were present.7 Wildlife populations and the habitats they rely on are also in steep decline.8 Recent research shows that even in remote areas such as the open ocean, the negative impacts of human activity on ecosystem function are much greater than previously thought.9
These global declines have spurred an urgent call for increasing conservation efforts worldwide. The Convention on Biological Diversity (CBD), a global agreement signed in 1994 to coordinate conservation efforts, includes a goal for all 196 nations party to the convention to set aside 17 percent of their lands and 10 percent of their oceans for conservation by 2020, including protections that cover the full range of habitats in each country.10 Complementary efforts are being made through both public programs and private investments to increase the resources that are dedicated to conservation, protecting and restoring nature’s contributions to people.11 Though the United States has signed the treaty, it has neither ratified it nor announced plans to.12
This report reviews trends in the conservation of lands and oceans across the United States, Canada, and Mexico—the three largest countries in North America—since the CBD was opened for signatures at the U.N. Conference on Environment and Development—also called the Rio Earth Summit—in 1992.13
The following sections examine these trends for both public and private lands conservation, as well as oceans protections. The result is a first-of-its-kind analysis of how protections have changed in North America. The data show that all three countries have made strides in different aspects of conservation, but they also reveal the challenges that remain for each country to meet agreed targets and better protect nature.
Protecting lands and oceans is important to the future of both natural systems and society. While Mexico and Canada have taken promising steps toward better stewardship, the United States has seen an overall reduction in protected areas since 2017. If this trend continues, it places the future of American wildlife in dire straits.
How the conservation trends were tracked
This study was conducted using data from the World Database on Protected Areas (WDPA). Maintained by the International Union for Conservation of Nature (IUCN)—an international coordinating organization that helps countries share best practices for conservation—and the U.N. Environment Program World Conservation Monitoring Centre (UNEP-WCMC), the WDPA represents the best available resource for determining how many protected areas there are in the world, how big they are, when they were established, and how strict the protections are within their boundaries.14 These data are used to track progress toward the goals of the Convention for Biological Diversity.15 Additional data for marine protections were drawn from databases maintained by the Marine Conservation Institute.16
A detailed methods section can be found at the end of this report. In summary, the authors analyzed trends in protected area designations from 1992 through 2018 in the United States, Canada, and Mexico. The starting point of 1992 was selected because it is the year of the Rio Earth Summit, which represented the start of a new phase of international coordination toward achieving set targets for land and ocean protection.
Although this analysis uses the best available data on trends in protected area designations, the database has some limitations should be acknowledged here.17 Protected areas are added incrementally to the database, and as a result, there is sometimes a lag before new protected area designations are included. Additionally, the limited number of variables—including only one variable for designation date—constrain how much of the history of protection in a specific place is included in the data. This means that, over time, strengthened or weakened protections for a given protected area may skew the establishment date. For example, protections for some areas will appear newer because the database uses the date of a change in protection—e.g., a national monument becoming a national park—rather than the earliest date of protection. In addition, protected areas must satisfy minimum international standards maintained by IUCN to be considered protected. As a result, some official protected area designations are not internationally recognized until their legal status and management have satisfied IUCN standards.18
Because the purpose of the database is to track existing protected areas, when protections are removed from lands or waters, these areas are no longer included in the database. To fill some of these gaps, the authors used data from the Protected Area Downgrading, Downsizing, and Degazettement (PADDD) database, which tracks reductions in land and ocean protections globally.19
Despite these limitations, the results below paint as clear a picture as possible of how the broad trends in protection of lands and oceans have changed over time. They also provide some explanation about why these patterns are being seen.
Glossary of useful terms
Protected area: Protecting lands and oceans generally means restricting human activities within an area, with the extent of restrictions roughly defining the strength of protection an area is considered to have. As a result, a protected area can include places such as wilderness areas, where all development is restricted, and national parks, as well as forests, where the protection of biodiversity is one of many management objectives, and activities such as selective logging can occur. There are a number of categorization tools that help standardize the strength of a protected area for comparing across international boundaries. The most widely used tool is maintained by the IUCN.20
Marine protected area: Marine protected areas refer to parts of the ocean where human activities are restricted to conserve ecosystems and natural resources. This primarily means restrictions on resource uses—in particular, fishing, oil and gas exploration, and mining. The strength of a marine protected area often hinges on the extent to which fishing is restricted, with no-take areas—places where all fishing is prohibited—considered to be the strongest level of protection. The Marine Conservation Institute has modified the IUCN system to create an international categorization system appropriate for the management needs and challenges of marine protected areas.21
Convention on Biological Diversity: The Convention on Biological Diversity (CBD) is an international accord that was opened for signatures following the Rio Earth Summit in 1992. It created objectives for countries to pursue in biodiversity conservation, including the establishment of protected areas to cover certain portions of the land and ocean area of signatory nations. Every few years, these objectives have been adapted into specific, time-sensitive targets—most recently, as the Aichi Targets in 2010—to protect a set amount of lands and waters by a certain date. At present, there are 196 parties to the accord, including 168 signatories.22
Aichi Targets: Named for the prefecture in Japan where negotiations occurred, the Aichi Targets are the basis for conservation objectives to be achieved by 2020 by countries that are party to the CBD. Aichi Target 11 addresses protected areas, including protecting 17 percent of land area and 10 percent of ocean area in each country party to the CBD by 2020.
Protected area downgrading, downsizing, and degazettement (PADDD): There are several ways that protections can be reduced for lands and oceans. The authors use the same terminology as researchers involved in the development of the PADDD database.23 Downgrading refers to reducing the legal restrictions on human activities in a protected area; downsizing is a reduction in the size of a protected area; and degazettement is the legal elimination of an entire protected area.
Protecting lands
Despite major increases in public land protections in Canada and Mexico since 1992, the United States has seen only modest gains
In 1992, of the three largest North American countries, the United States had far and away the greatest extent of land protected, with roughly 10 percent of its total lands under conservation. (see Figure 1) This achievement was the byproduct of a century of leadership and investment in conservation. Canada had approximately 6 percent of its lands protected, and Mexico lagged far behind its neighbors, with roughly 2 percent of its lands under conservation management.
There is a positive trend in land protection for all three countries since 1992, but the trends are very different for each. (see Figure 1) In Mexico, nearly 90 percent of current land protections have been granted since 1992—resulting in roughly 14 percent of its total land being under conservation management—the highest overall in North America. Although most of Mexico’s national parks were established in the mid-20th century, the country added large numbers of sustainable use and biosphere reserves and strengthened protections for existing reserves during the 1990s and 2000s. While these protections are not as strong as wilderness areas or most national parks, they do result in positive conservation outcomes.24 This expansion coincided with the establishment of national commissions on biodiversity and protected areas, as well as increased investment in law enforcement and management of protected areas. With these steps, Mexico has made notable improvements to its stewardship of biodiversity over the past 25 years.25
The expansion of land protections in Canada has not been as rapid—roughly 10 percent of its land is protected, lagging behind the United States and Mexico—but nearly half of its current protections have been implemented since 1992. This progress is the result of a commitment by provinces and territories to protect large portions of lands under their jurisdiction, as well as the recent establishment of a few large federally protected areas.26 Recently, government agencies at the federal, provincial, and territorial levels have engaged in closer collaboration with indigenous peoples to plan new protected areas. Progress has accelerated over the past year, with the announcement of several large protected areas and a commitment from the federal government to spend $1.3 billion over the next five years to expand the protected area network.27
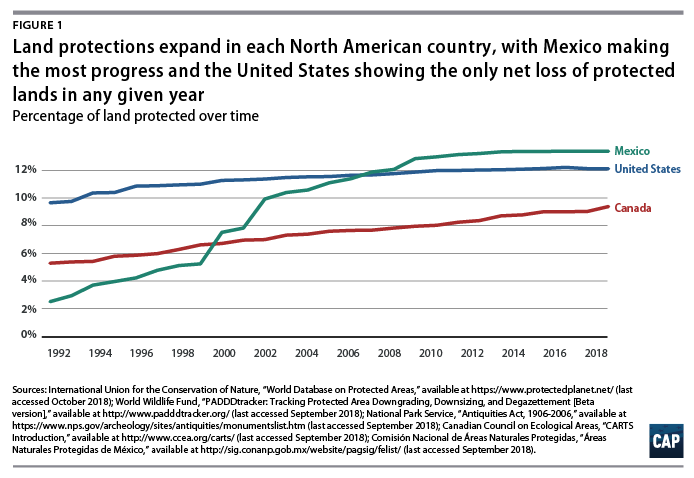
Despite this growth, none of the three countries have protected 17 percent of their land—the Aichi Target for 2020. Mexico has made the greatest advancement toward this goal, as it is now nearly 3 percentage points away from the Aichi Target.
The United States is unique in that it is the only country of the three largest North American countries to show a net loss in overall protected area in any year. The Trump administration’s 2017 cuts in protections for the Grand Staircase-Escalante and Bears Ears national monuments—which reduced their size by 50 percent and 85 percent, respectively—affected slightly less than 2 million acres of land and, as such, represents the largest reduction in protected areas in the nation’s history.28 Weeks after President Trump announced the reductions for these two Utah monuments, Congress passed tax legislation that also opened up 1.5 million acres of the previously off-limits Arctic National Wildlife Refuge to oil exploration, and Secretary Ryan Zinke agreed to allow a road to be built through the Izembek National Wildlife Refuge, further weakening the integrity of U.S. protected lands. Taken together, these lost or weakened protections affect 3.3 million acres—an area 50 percent larger than Yellowstone National Park.
The only comparable event on record elsewhere in North America was a 2013 change in classification of Mexico’s Nevado de Toluca National Park to a sustainable use reserve. This downgrade in protections occurred over a much smaller area—130,000 acres—and allowed local communities to conduct limited collection of natural resources within the reserve. However, the land was still protected from the significant impacts of mining and other extractive industries, a prohibition that was deliberately removed from both Grand Staircase-Escalante and Bears Ears national monuments by the Trump administration and from the Arctic National Wildlife Refuge by Congress.29
While public land protections lead the way, progress is slow on private land
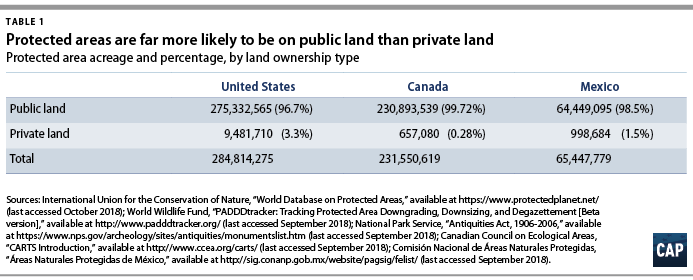
Public lands protections play a dominant role in conservation globally and in the protected area strategies of the United States, Canada, and Mexico. However, conservation on private lands is acknowledged as a critically important component of conservation strategy, given the uneven distribution of public lands across different regions and ecosystems.30
Across each of the three North American countries, private conservation lands represent less than 4 percent of the protected area system. (see Table 1) Overall, the United States has the highest level of private lands conservation, due in large part to federal and state incentives for conservation easements, as well as high levels of private land ownership.31 Lower rates of private lands conservation in Canada can be attributed, in part, to having a much higher proportion of public and provincial land ownership, but they are also due to gaps in Canada’s records on private lands conservation, which it has committed to improving by 2020.32 In Mexico, data show that progress in conserving private lands accelerated only recently, possibly facilitated by land reforms in 2001.33
 These data reinforce the major opportunities and challenges for land conservation. First, they demonstrate how central public land is to conservation. While some gains have been made in increasing private lands conservation, public lands—especially national parks and forests—anchor large-scale conservation programs, even in areas dominated by private lands.
However, in the long term, the bias in protections toward regions with high levels of public land represent a major challenge for effectively protecting ecosystems. Public land is disproportionately distributed in places where the demand for land is lower, often because it is remote, rugged, dry, or some combination of the three. The ecosystems in these places are more likely to receive protection, while habitats in areas that are more conducive to human development are left vulnerable—places such as wetlands, grasslands, rainforests, and deciduous forests.34 Therefore, identifying effective strategies to increase conservation on private lands is urgently needed, and the World Database on Protected Areas data suggest that much remains to be done.
Protecting oceans
All three countries take their own approach to protecting a neglected region
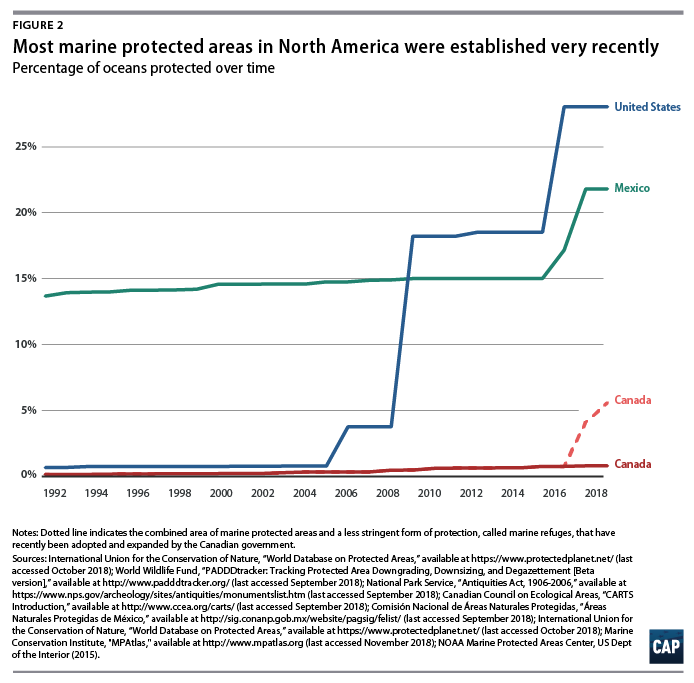
Although oceans are home to rich ecosystems that provide immense economic and cultural value to society, they have only received large-scale protections in the past few decades as a better understanding has been gained concerning human impacts on marine life. Since 1992, the number of marine protected areas (MPAs) has increased dramatically, especially in the United States. (see Figure 2)
The United States creates huge reserves, mostly in distant territorial waters
The United States has protected the largest portion of its territorial waters out of the three largest North American countries—nearly 26 percent. This investment in marine conservation is relatively recent; almost all of these MPAs have been designated since 2004.35
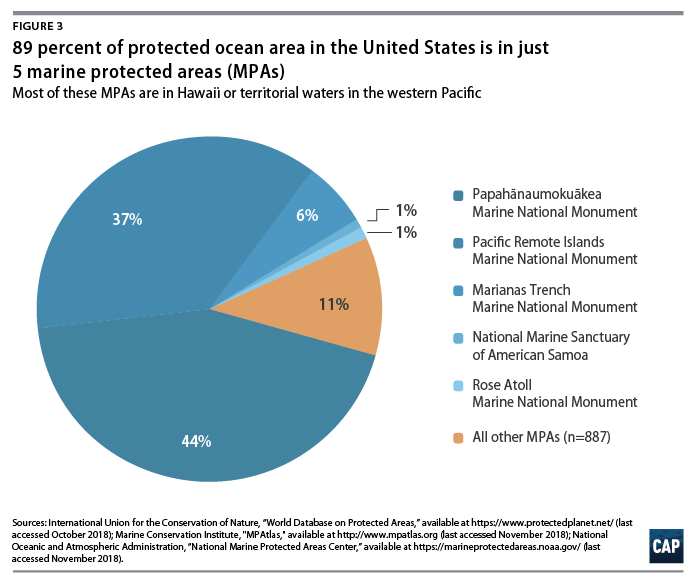
It is worth noting that the distribution of these protected waters heavily favors areas outside the continental United States. (see Figure 3) More than 40 percent of the overall MPA estate in the United States is in one MPA: the Papahānaumokuākea Marine National Monument in northwestern Hawaii. Another 45 percent is in a handful of national monuments and marine sanctuaries in the western Pacific Ocean. While these are biologically important places, it is worth pointing out that the percentage of protected waters off the West Coast, the Gulf of Mexico, and the East Coast of the United States is much lower despite the unique ecosystems and economic values these waters support.
 Canada forges a new path to greater marine protections
Canada has pursued its own unique approach to expanding its ocean conservation system. Given the challenges of balancing the economic and cultural importance of fishing in the country, the Canadian government has pursued both MPAs and what it defines as “other effective area-based conservation measures,” which involve restrictions on fishing and other activities to protect specific features, such as coral reefs and spawning grounds, that are ecologically important or unique.36
While the overall extent of MPAs remains low—they account for less than 1 percent of Canada’s oceans—these other conservation measures, also called marine refuges, have expanded dramatically in the past two years and now cover more than 5 percent of Canada’s oceans. (see Figure 2) A new MPA, called Tallurutiup Imanga, is in the process of being established as well. When designated, it will add protections to 109,000 square kilometers of the Arctic Ocean—almost 2 percent of Canada’s ocean territory.37 In addition to this impressive spike in new and proposed protections, the government has also recently released new guidelines for the planning and development of new MPAs, including protection standards and co-management strategies to work with indigenous peoples, with the goal of making it easier to create new MPAs in the future.38
Mexico’s MPA system continues to grow
In 1992, Mexico was the leader among the three countries in terms of ocean area under some form of protection. This is notable because of Mexico’s early adoption of this conservation approach, but also because the country does not have the same vast ocean territories as the United States or Canada. While the United States has passed its neighbors in terms of relative area protected, Mexico has maintained its commitment to marine conservation. In addition to older MPAs in the upper Gulf of California and the Colorado River Delta, Mexico has recently designated large areas off the west coast of Baja California and in the Caribbean to protect ecosystems and fisheries.39 This increase in ocean protections has created an opportunity for future investments in management to better conserve the country’s marine resources.
Progress on the strongest ocean protections varies by country
In North America, the most effective designations—no-take reserves, which fully restrict commercial fishing—have, until recently, been limited to the United States.40 These types of reserves are especially important to the long-term health of ecosystems, as they have been shown to have much larger positive effects on fish populations than other MPAs—even those with heavily regulated fishing.41 As the value of these strong protections has become more widely recognized, each of the three countries has taken a different path toward incorporating them into their MPA system.42
The United States remains a leader in designating no-take reserves, and a handful of very large no-take designations now represent more than 80 percent of the overall MPA area in the country. However, as with MPAs generally, the majority of these areas are located in distant territorial waters, primarily northwest of the main Hawaiian Islands and in the western Pacific Ocean. The recent designation of the Northeast Canyons and Seamounts Marine National Monument off the coast of New England adopted a slow phasing-in approach to no-take protections closer to the continental United States. However, there is concern that this commitment could be undermined by the Trump administration.43
Mexico has made significant marine designations since 2015, including large new no-take protected areas near the Baja Peninsula.44 Canada has yet to implement similar MPAs, but the release of new guidelines and expansion of less restrictive conservation measures appear to be steps toward eventual expansion of its MPA system.45
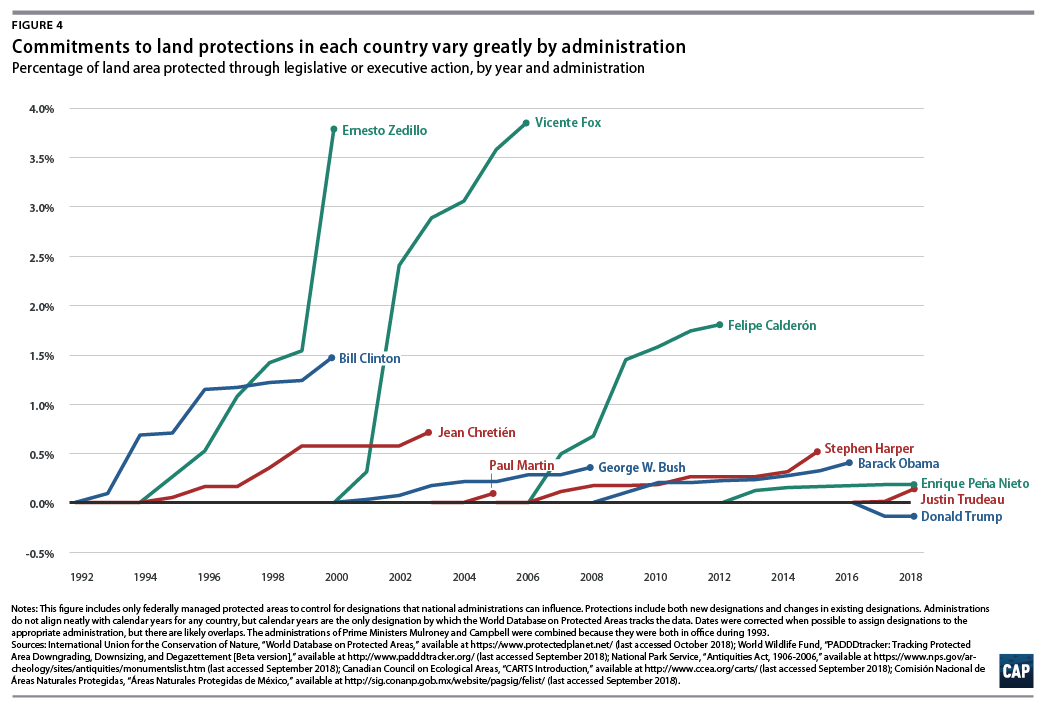
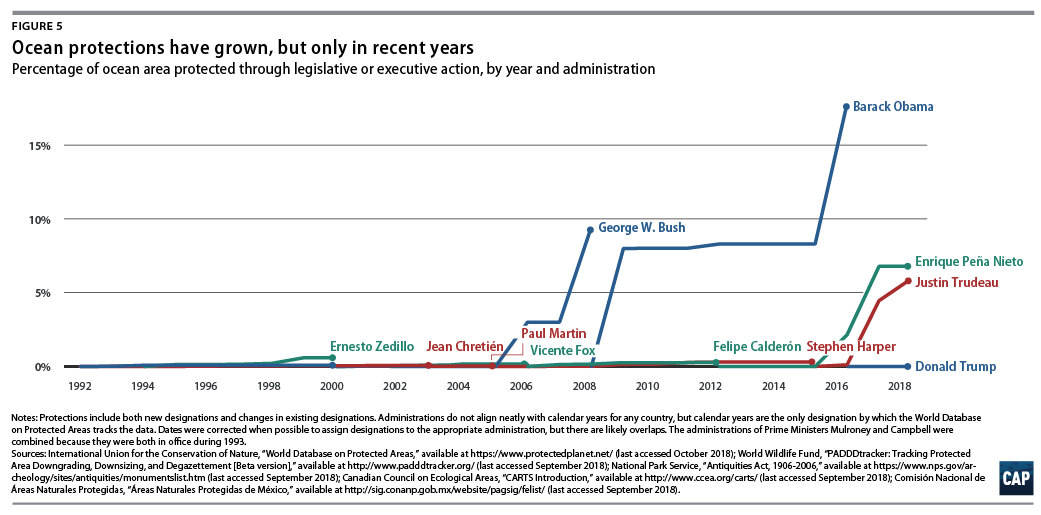
The impact of political leadership
Across all three countries studied, only one administration over the past 25 years facilitated an overall decline in land or ocean protections. (see Figures 4 and 5) President Donald Trump’s reduction of Bears Ears and Grand Staircase-Escalante national monuments, along with his removal of protections in the Arctic and Izembek national wildlife refuges, have led to a contraction of roughly 1.2 percent of the U.S. protected area estate—an area 50 percent larger than Yellowstone National Park. This has effectively erased the United States’ overall gain in lands protections since 2015.46
Prior to the Trump administration, the rate of land protection in the United States had slowed since the mid-1990s. While the use of executive authority through the Antiquities Act of 1906 has resulted in major new protections in the past two decades for lands and large areas of U.S. oceans—especially around distant islands in the western Pacific Ocean—congressional action to protect land and ocean areas has become less frequent. In the past decade, only three major pieces of successful land protection legislation have passed into law in the United States: the Omnibus Public Land Management Act of 2009, the National Defense Authorization Act (NDAA) for Fiscal Year of 2013, and the 2015 Sawtooth National Recreation Area and Jerry Peak Wilderness Additions Act.
In Mexico, the administrations of former Presidents Ernesto Zedillo (1994–2000) and Vicente Fox (2000–2006) implemented management improvements and expansions of the country’s protected area estate after decades of low investment.47 These improvements included the establishment of national commissions on biodiversity and protected areas, which helped build capacity for managing natural resources.48 Federal budgets for conservation in Mexico also increased dramatically during the 1990s.49 This investment resulted in improved protections for several large reserves that had been designated in the mid-20th century and resulted in a substantial increase in the effectiveness of protected areas covering significant portions of Mexican territory.50 (see years 2000 and 2002 in Figure 1) More recently, conservation priorities have appeared to shift somewhat to protecting more of Mexico’s marine ecosystems. While the administration of current President Enrique Peña Nieto has not protected as much land as its predecessors, it has made considerable additions to the country’s marine protected area network.51
In Canada, the annual rate of expansion of both terrestrial and marine protected area systems has been relatively constant, with the exception of the dramatic uptick in marine protections in the past two years. Although Canada has lower protected area coverage than the United States or Mexico, its push to extend marine protections, invest in greater collaboration with indigenous peoples, and adopt new guidelines for establishing protected areas all should lay the groundwork for growth in the nation’s protected area estate.
Conclusion
Protecting lands and oceans is critically important to effective stewardship of wildlife and ecosystems and to the health of our economy and society.
The United States has long been a trailblazer in conservation, creating the first national park and leading the way in developing protected area systems and capable public agencies to manage them. However, the data support the concerns that have emerged since the Trump administration announced its plans to shrink Grand Staircase-Escalante and Bears Ears national monuments: The United States has foregone its role as a global leader in land and water conservation. Instead, Canada’s and Mexico’s progress toward their 2020 commitments stand out as examples of conservation leadership in North America.
There are other bright spots in the data—including stronger protections for ocean territories within each country. However, most of these designations have only occurred during the past ten years, and it remains to be seen whether this trend continues. Addressing the extinction crisis and meeting international commitments will require continued investment and dedication.
About the author
Ryan Richards is a senior policy analyst for Public Lands at the Center for American Progress.
Acknowledgements
The author would like to thank Matt Lee-Ashley, Margaret Cooney, Miriam Goldstein, Kate Kelly, and Andrew Edkins for their contributions to this report, as well as Clinton Jenkins and Rachel Golden Kroner for their review of the methodology.
Methods
Evaluating progress in land protection
All analyses for terrestrial protected areas were conducted using records from the International Union for Conservation of Nature (IUCN) World Database on Protected Areas (WDPA), with some modifications—which are explained below. Data maintained by the WDPA are considered to be the most comprehensive for global analyses of protected area systems, as countries that are party to the Convention on Biological Diversity (CBD) report protected area data to IUCN as part of their commitments. The U.S. Geological Survey (USGS) also provides the WDPA with data from its Protected Areas Database (PAD-US), although the United States is not a party to the convention. Additional data were drawn from the U.S. National Park Service for recently designated national monuments and from the Protected Area Downgrading, Downsizing, and Degazettement (PADDD) database for reductions and weakened protections to protected areas in the United States, Mexico, and Canada.52
Preparing the WDPA data for analysis required several “cleaning” steps. Only protected areas from the three countries included in the study—the United States, Mexico, and Canada—were retained from the full WDPA dataset. Of these, additional protected areas were omitted if they were listed in the database as “unverified” by either a state or an IUCN expert. To minimize repetition and overlaps, entries were also dropped if they described only international recognitions. For example, areas listed under the Ramsar and World Heritage conventions were left out of the data. In addition, protected areas that had been proposed but not officially designated—for instance, due to legal protections that had yet to take effect—were not included. These filters removed 454 entries from the dataset.
There were some gaps in the data that needed to be addressed prior to the analysis. Notably, 16,376 protected areas in the United States were missing designation dates, representing almost 50 percent of data entries but a relatively small percentage—less than 1 percent—of the overall area of the U.S. protected area system. Designation dates were added manually for 1,554 entries, using online records from federal and state agencies. Although dates were only added for 9.4 percent of protected areas missing a designation year, these revised entries represented 51 percent of the area that had lacked a designation date—approximately 13 million acres of 25 million acres.
National Forest System lands in the United States without wilderness designations have been omitted from the WDPA dataset.53 However, CAP felt that some of these lands merited inclusion given administrative protections accorded by their land management plans, so those designations were added using the USGS PAD-US data.*
Some recent designations were also missing from the WDPA, which is regularly updated but does exhibit lag time based on country contributions. CAP added U.S. national monument designations from a list maintained by the National Park Service.54 Newer protected areas in Canada and Mexico were retrieved from each country’s relevant ministry or agency.55
Categorizing protected areas as occurring on public—federal and state—or private lands was accomplished by using groupings derived from the “management authority” variable in the WDPA. The full list of variables included in each category is available from the author upon request. Following these data cleaning steps, trends were calculated using the designation dates, or status year, and the calculated terrestrial areas for each protected area.
Understanding marine protected area (MPA) trends
Data on marine protected areas are still maintained by the WDPA, but debates over appropriate categorizations of protection led CAP to use different definitions than were used for the analysis of terrestrial protected areas. The Marine Conservation Institute, which manages the site MPAtlas.org, has coordinated the development of an MPA-specific set of protection classifications. This includes a standard minimum definition of an MPA and data on whether an area has specific no-take protections.56 These two categories were used for this report.
Data preparation was conducted using the same approach described above for land protections. Data quality was overall much higher for the MPA database—there were no missing designation years. As with the lands data, some new MPAs were retrieved from the agencies responsible for marine protections in the United States, Canada, and Mexico.57
Once the data were cleaned, trends were examined for the designation of both MPAs and no-take reserves for the three countries, using the designation dates, or status year, and the calculated marine area for each protected area.
* Correction: May 6, 2021: This report has been updated to clarify the National Forest System lands that were considered protected in this analysis.