Author’s note: CAP uses “Black” and “African American” interchangeably throughout many of our products. We chose to capitalize “Black” in order to reflect that we are discussing a group of people and to be consistent with the capitalization of “African American.” In this product, we use “Black or African American” and “Hispanic or Latino” to match the data source analyzed.
In 2017, the U.S. Department of Education released groundbreaking data showing that half of Black or African American borrowers who first entered college in the 2003-04 academic year defaulted on their student loans within 12 years.1 New federal data released this fall show that these numbers have not improved: Black or African American borrowers who started college in 2011-12, almost a decade later, have continued to face high default rates. And a more limited comparison of default rates six years after entry for students who borrowed in their first year of college shows minimal changes across cohorts. This suggests that the crisis among Black borrowers has persisted—even as federal policymakers created a series of loan repayment options to try to help individuals struggling with debt.
The data come from the latest update to the Beginning Postsecondary Students Longitudinal Study (BPS).2 This study tracks students who first entered college in the 2011-12 academic year for six years, through 2017. The data add a significant new element to policymakers and researchers’ understanding of student loan repayment. This is the first time a U.S. Department of Education longitudinal study tracked undergraduate students who began college after 2007, when Congress started creating more generous income-driven repayment (IDR) plans. Thus far, IDR is the main solution that policymakers have devised to help struggling borrowers. These plans reduce monthly payments by capping them at a set share of income.
The BPS data show that roughly one-fifth of borrowers in repayment at the end of the six-year tracking period were using IDR. While differences in the overall usage of IDR by race are small, one-third of Black or African American borrowers in repayment in 2017 with a bachelor’s degree were using IDR, a much higher rate than other borrowers with the same level of education. (see Table 4) Continued high default rates, despite the use of IDR, suggest either that outcomes would be much worse without it or that there must be other solutions to better serve borrowers most at risk of default. Unfortunately, the data cannot indicate which hypothesis is correct.
Here’s a closer look at what the new data can tell us about default and repayment, especially for Black borrowers.
Black borrowers’ default rates remain high
Table 1 shows that default rates for Black or African American borrowers remain higher than those for their peers, regardless of the type of higher education institution they attended. Within six years of starting college, one-third of all Black or African American borrowers who had entered repayment defaulted on their loans, compared to just 13 percent of their white peers.
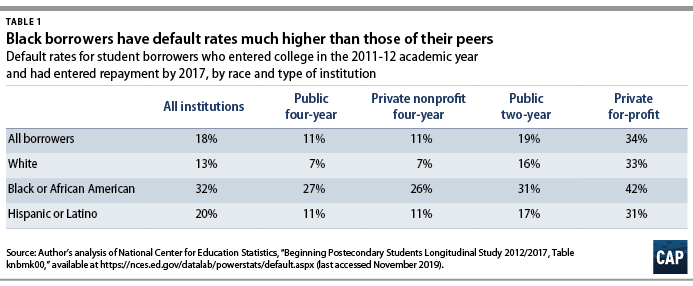
Students attending private for-profit colleges had the worst default rates across all institution types. One-third of all borrowers defaulted within six years of starting at a private for-profit institution, including 42 percent of Black or African American borrowers. While the default rates for private for-profit institutions are alarming, there are also concerning gaps by race at public and private nonprofit four-year institutions. At these schools, Black or African American borrowers had a default rate nearly four times greater than white borrowers and more than double that of Hispanic or Latino borrowers.
Similar to prior studies, the BPS data show that students who defaulted tended not to borrow large sums of money.3 The median defaulter took out just $6,750 in loans—less than the maximum amount a student can borrow for their first year of school if they are not receiving financial assistance from their parents, $9,500.4
Unfortunately, the data cannot tell us exactly why the results for Black or African American borrowers are so much worse than those for other racial or ethnic groups. Attempts to look at differences in income, months employed or unemployed, or other factors yielded estimates with standard errors that were too large to trust the reliability of the estimate. The data also cannot shed light on other factors that are likely important, such as employment discrimination and differences in familial wealth.5
Debt with no degree is a bad place to be
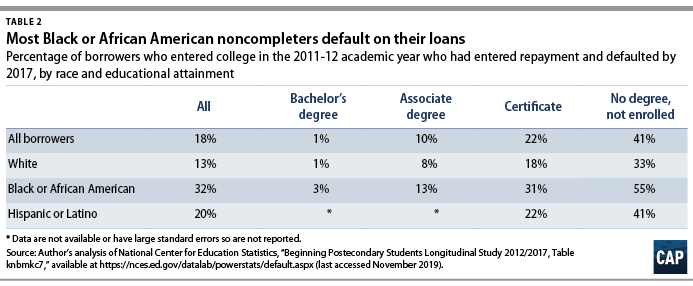
The new data match similar findings from other analyses of Department of Education datasets: Borrowers who do not finish college face high chances of defaulting.6 According to the BPS data, more than 40 percent of 2011-12 entrants who borrowed but did not earn a credential defaulted, including a shocking 55 percent of Black or African American borrowers. (See Table 2) Students who earned a certificate had a default rate about half that of noncompleters. Unfortunately, the six-year measurement period is not long enough to allow one to derive many conclusions about bachelor’s degree recipients, who would have had, at most, two years of repayment experience. This means that this analysis cannot provide an update on the finding for the 2003-04 cohort that completing a degree did less to insulate Black or African American borrowers against default than their peers.7
Default rates aren’t falling
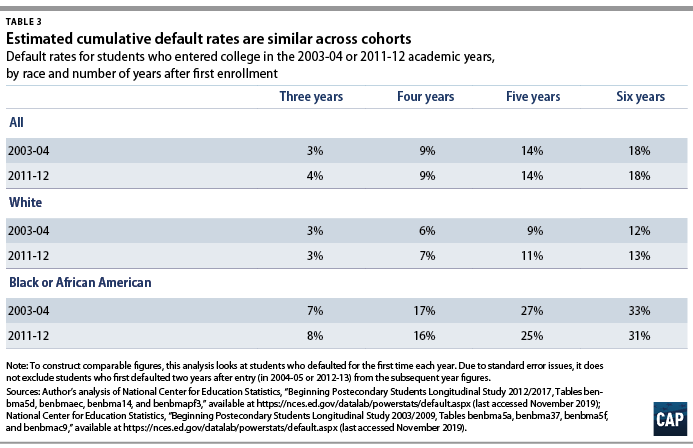
Unfortunately, variable limitations in the public tool used to pull these data make it hard to compare the default rates of the new cohort to those of older cohorts six years after entry. Because of these limitations, the closest but still imperfect way to make a consistent comparison between 2011-12 entrants and those who started in 2003-04 is to look at those who borrowed in their first year of enrollment—although this admittedly leaves out substantial chunks of borrowers. About one-third of 2003-04 entrants who borrowed within six years did so after their first year of enrollment compared to about one-fifth of 2011-12 entrants.8 This analysis also will double count borrowers who defaulted multiple times during the measurement window, which could artificially inflate results. It also cannot control for whether first-year borrowers had entered repayment with enough time to default in the six years analyzed. These results are thus better for a broad sense of how similar trends look rather than a focus on specific figures.
Looking only at first-year borrowers shows minimal changes in six-year default rates from the 2003-04 to the 2011-12 cohorts. Both cohorts have an overall default rate of 18 percent, while the 2003-04 cohort and the 2011-12 cohort have a Black or African American borrower default rate of 31 percent and 33 percent, respectively. These numbers suggest that, at the very least, default rates have not gotten substantially better over the eight years between the two cohort entry points.
One-third of Black borrowers with a bachelor’s degree use IDR
These new data also provide the best look to date at the impact of IDR plans on borrowers’ repayment success. IDR plans cap borrower payments at a set share of earnings and do not require particularly low-income borrowers to make any payments. Though the first IDR plan began in the early 1990s, it requires borrowers to pay a very large share of their income and has low usage rates.9 Starting in 2007, Congress and the administration began creating more generous IDR options, which have become increasingly popular with borrowers.10 Therefore, this iteration of the BPS is the first one to cover a cohort that had access to at least one of the more widely used IDR plans as soon as they left school.
As Table 4 shows, 18 percent of the borrowers who started college in 2011-12 and were in repayment in 2017 were using IDR. Students who earned a degree were far more likely to use IDR than those who did not. IDR plans appear to be particularly important for Black or African American borrowers who earned a bachelor’s degree, with one-third of these borrowers in repayment using IDR—the highest rate of any racial and educational attainment grouping.
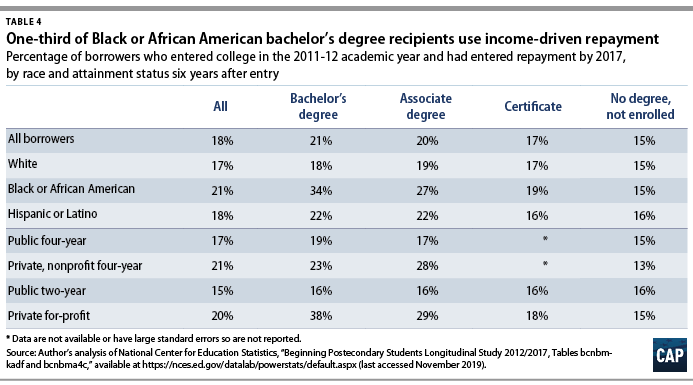
There are also differences in IDR usage by sector for students who earned bachelor’s degrees. Among those who finished a bachelor’s degree, 38 percent of students who attended a for-profit were using IDR versus 23 percent at private nonprofit four-year schools and 19 percent at public four-year institutions. The gaps are much smaller for other levels of attainment.
The data also show that IDR may be helping borrowers who were more likely to default but ultimately did not do so. Among borrowers who did not graduate or only earned a certificate, nondefaulters used IDR at rates two to three times higher than their peers who did default. Among noncompleters, 21 percent of nondefaulters used IDR compared to just 7 percent of defaulters. For certificate graduates, the split was 19 percent to 10 percent for nondefaulters and defaulters, respectively.11 This at least suggests that, for some students in these categories, IDR may have played a role in keeping them out of default.
About half of IDR users have a $0 monthly payment
A closer look at IDR users shows that, although they have higher amounts of federal debt than their peers on non-IDR plans, a near majority have a $0 monthly payment. This means that their income is so low that they can’t afford any loan payment.
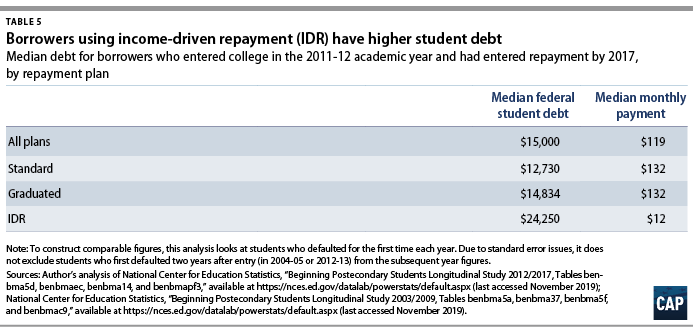
As Table 5 shows, the median amount of debt on IDR from a borrower who entered college in 2011-12 and was in repayment in 2017 was $24,250—nearly double what someone who used the standard plan of equal installments over 10 years owed. However, the median monthly payment shows the opposite phenomenon—the median payment for a borrower on an IDR plan was $12, less than one-tenth what borrowers on other plans paid.
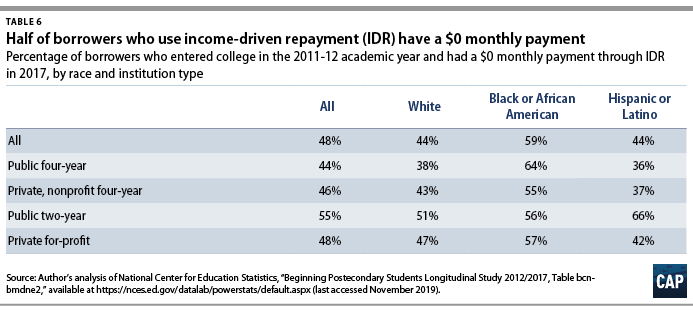
The median payment is so low because a majority or near majority of borrowers on IDR have incomes that are not enough to require a monthly payment. (See Table 6) Overall, 48 percent of all IDR borrowers had a $0 monthly payment. This includes 59 percent of Black or African American borrowers.
Unfortunately, these data cannot convey how long borrowers have been on IDR plans. This matters because some $0 payments may be misleading. Payments are generally calculated based on the last completed tax return. That means, depending on when a borrower signed up for IDR, their payment may be calculated off of what they earned a year or two prior. For example, a borrower who signed up for IDR in January 2017 is potentially using their 2015 income since they probably had not filed a 2016 tax return when they enrolled. That means there is some chance that the high rate of $0 payments reflects large numbers of students who are using income data from when they were in college.
The high share of borrowers with a $0 payment also has potential implications for the long-term ability to repay debt. Interest still accumulates on IDR plans, with the exact policies depending on the specific IDR plan chosen. Some IDR options cover half of accumulating interest during the entire time borrowers are on the plan, while others only cover the interest that grows on subsidized loans during the first three years in repayment.12 That means borrowers who are on IDR for long periods of time making low payments will likely see their balance grow. This is particularly worrisome because past analyses already showed significant gaps by race in the share of original loan balance repaid by borrowers over time.13
Is graduate borrowing affecting IDR data?
It is hard to tell what role, if any, graduate school borrowing plays in these IDR results. Other Department of Education data indicate that borrowers with higher debt loads that are most likely accumulated through graduate study use IDR at much higher rates than those with lower balances.14 But these data do not reflect such a difference. Students with debt for both graduate and undergraduate education have an IDR usage rate of 23 percent, while students who only borrowed for their undergraduate studies have an IDR usage rate of 20 percent.15 And Black or African American borrowers with a bachelor’s degree who only borrowed for undergraduate education have a much higher IDR usage rate than Black or African American borrowers who have debt for both graduate and undergraduate education—37 percent versus 20 percent.16 Unfortunately, the sample sizes in the BPS are too small to see how the difference in IDR usage by graduate or undergraduate borrowing looks at private for-profit colleges.
Most likely, two data limitations mean that this analysis cannot account for the effect of graduate borrowing. First, a borrower has to be in repayment in 2017 to look at their payment plan. This means that someone currently in graduate school is not counted in the data. This issue is compounded by the fact that the data only look at results six years after entry, meaning that many students who earned a bachelor’s degree may have not yet attended graduate school or are still enrolled in a graduate program.
Conclusion
The long-term loan outcomes for Black borrowers released in 2017 were some of the most shocking figures ever seen for higher education. Sadly, the updated data suggest that students who enrolled eight years later did not have better outcomes. Such worrisome results, even with the availability of IDR, suggests that repayment plans that reduce monthly payments are a necessary but ultimately insufficient tool for addressing loan default. This is especially true for Black borrowers, who are already more likely to use IDR yet still experience higher default rates. While lowering payments can help borrowers, the paperwork to enroll and reenroll in IDR plans can still be a barrier.17 In addition, the continued accumulation of unpaid interest while on IDR may make these plans feel like short-term solutions with negative long-term effects. The latest BPS data indisputably show crisis-level outcomes for Black borrowers—results that are not getting better. Policymakers must put forward bigger and bolder solutions for dealing with student debt.18
Ben Miller is the vice president for Postsecondary Education at the Center for American Progress.