Click here to view the accompanying interactive map.
Introduction and summary
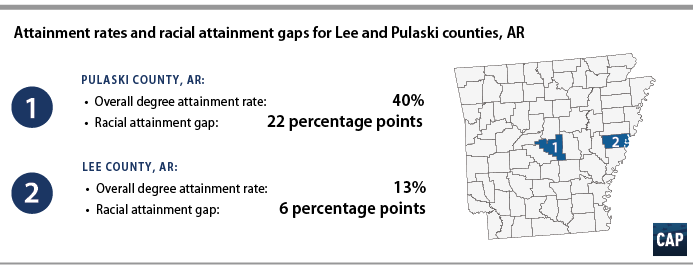
In the heart of the Arkansas Delta lies Lee County, a rural area with a deep history. Cotton, an industry sustained by slaves and, later, African American sharecroppers, once ruled Lee County.1 To this day, the majority of the county’s residents are black and, like in many rural areas across the country, the population is declining.2 One hundred years ago, during its height, Lee County was home to nearly 30,000 people, but its population is now one-third of that size.3 Nearly a quarter of the county’s residents live in poverty,4 and just 13 percent of adults have an associate degree or higher.5 High school dropouts outnumber college graduates 2-to-1.6
These low rates may be in part caused by Lee County’s distance from many college options. A student living in the county seat, Marianna, for example, would have to drive 18 miles to get to the nearest community college campus—more than twice as far as the average community college student typically commutes.7 The next closest option, a for-profit beauty school, lies about 40 minutes away. The closest four-year, public, in-state option would require a four-hour round trip.
Two hours west, Pulaski County, the home of Little Rock, offers a stark contrast. There, the population has more than tripled in the same time frame.8 The poverty rate is half that of Lee County,9 and about 40 percent of adults have at least an associate degree.10 Thirty-six colleges lie within the county limits, including three historically black colleges and universities (HBCUs).11
It may seem like Pulaski County has all the successes that Lee County does not, but the story is not so simple.
Though Pulaski County has relatively high attainment rates compared with the rest of the nation, that high rate masks a problem: a 22 percentage point gap between the bachelor’s degree attainment rates of white residents and those of black, Latinx, and Native descent,12 who have been historically underrepresented in and underserved by postsecondary education in the United States.13 Meanwhile, in Lee County, the attainment gap is much smaller, at 6.4 percentage points; the problem there is low attainment overall, among all groups.
These contrasting narratives—of low overall attainment in rural areas and highly stratified rates in urban ones—play out on a national scale. The United States has boosted attainment rates over the past decade, with the share of young adults with at least an associate degree increasing by 20 percent, resulting in an additional 5 million more individuals earning a college degree.14
Rural areas tend to have low overall attainment, whereas urban areas tend to have the largest racial attainment gaps.
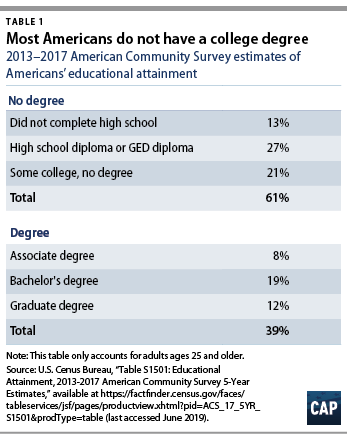
But these gains in postsecondary attainment are not evenly distributed across the country. Of the 218.6 million adults in the United States—defined as those ages 25 or older for the purposes of this report—slightly less than 40 percent have earned an associate, bachelor’s, or graduate degree.15 While about 35 percent of white adults hold a bachelor’s degree or higher, only 18 percent of underrepresented adults do. And overall, just 8 percent of bachelor’s degree-holders live in rural counties.16
This report lays out the current state of postsecondary attainment in the United States, exploring the overall landscape and delving into how attainment varies according to geography and race. It highlights three case studies to illustrate these disparities: Nye County, Nevada; Washington, D.C.; and Hialeah, Florida. Then, the report concludes by providing recommendations at the federal, state, and local levels.
Though there are many paths that can lead one down a fulfilling and prosperous path, a college degree—in particular, a bachelor’s degree—provides the most reliable, systemic means of achieving a better future. This is particularly true for people of color, even though the returns to their education are not as strong as they are for white individuals. Until the United States can create multiple high-quality paths to the middle class for all Americans, a college education will continue to be the difference-maker for millions of people.
So as policymakers consider broad initiatives for postsecondary education—whether they address college access, completion, or affordability—they cannot ignore the role of place in how Americans interact with the nation’s postsecondary system. The payoff for future investments must be felt broadly and, in particular, should lift up those who have been pushed to the margins for too long.
Mapping college attainment
This report uses American Community Survey data aggregated from 2013 to 2017 to illustrate how each of the roughly 3,220 counties in the United States and Puerto Rico stack up in terms of degree attainment for adults.17 The accompanying interactive map, “Who Is Left Behind?,” highlights attainment at the associate degree level and above.18 Unfortunately, the census data do not include certificate completion rates. Though these credentials are a popular means to building career-relevant skills, only about 5 percent of adults have earned a workforce-relevant certificate.19
The map also presents gaps in bachelor’s degree attainment between white adults and adults from underrepresented groups—for the purposes of this report, classified as those who identify as black or African American, Hispanic or Latinx , American Indian or Alaska Native, or Native Hawaiian or other Pacific Islander.20 Adults who identify as Asian are not included, as they have higher overall attainment rates than white adults, and the data do not allow disaggregation for underrepresented Asian groups.
Finally, the map includes the locations of nearly 13,000 college campuses. Prior research on postsecondary education locations has relied on incomplete data,21 but those presented here are culled from the U.S. Department of Education’s database on colleges that participate in the federal financial aid programs.22 This project therefore represents one of the most comprehensive maps of institutions of higher education in the United States. While identifying college locations is not an exact science, the map is intended to make the reader rethink what constitutes a college campus; some locations are housed in office buildings, while others might be located on military bases—and still more may be embedded on the campuses of other colleges.23
More information on the methodology can be found at the end of this report.
As readers peruse this report, they can follow along on the interactive map, which allows users to explore various regions. When they are finished reading, they can explore further using the key, search bar, and zoom tools.
The national picture
What does it mean to have a college degree in America? Some may take it as a given, as their families have attended—and finished—college for generations. Others may see it as an option alongside other viable paths, such as taking over a family business, learning a trade, or making a home for their spouse and children. However, more may think of college as out of reach, perhaps because they do not know anyone with a degree or because their circumstances make enrollment seem untenable.
On the whole, attending college leads to better long-term outcomes. Adults with just a high school diploma are three times more likely to live in poverty as are those with a bachelor’s degree or higher.24 Median annual earnings increase with additional postsecondary attainment, and in spite of the proliferation of student loan debt, graduates experience an improved ability to generate wealth, build healthy lives and families, and contribute to the tax base and their communities in comparison to those with only a high school diploma.
Though greater numbers of Americans have a college degree than ever before, more than 60 percent of adults—roughly 133 million in all—have not earned one.25 In terms of education status, the largest group in the nation is those whose highest level of attainment is a high school or GED diploma (59.7 million), followed by those with some college but no degree (45.2 million). This second group includes certificate-earners, though it is difficult to know what share of these individuals fall into this category. Those without a high school diploma are the smallest group of adults without a degree.
Of college degree-earners, those whose highest degree is a bachelor’s form the largest group (41.8 million). About 18.1 million have an associate degree as their highest credential, while 25.7 million have a graduate degree.
These figures highlight that attainment is quite stratified, and attainment at the highest levels is limited. For example, adults without a high school diploma outnumber those with a graduate degree by about 2.3 million. To put these figures into perspective, the number of adults with a graduate degree is about the same as the population of Texas, whereas the number of adults with no college degree is roughly equivalent to the combined populations of Texas, California, Florida, New York, Pennsylvania, Illinois, Ohio, and South Carolina.26
Also notable is the number of adults who have enrolled in college but either dropped out or earned a certificate instead. Though these individuals do tend to earn more than those with only a high school diploma, this earnings premium is only about 20 percent—compared with bachelor’s degree-holders, who earn more than 50 percent more per year, and graduate degree-earners, who earn more than twice what high school graduates make.27 This population also presents an opportunity: If just half of those with some college but no degree went on to complete college, more than 22 million more adults would have a college education, and the country’s national degree attainment rate would surpass 50 percent.
Rural America
The interactive map shows that degrees are held largely by those in urban and suburban areas. The lowest-attainment counties, meanwhile, are heavily concentrated in rural areas. Of the bottom 10 percent of counties in terms of attainment, 84 percent can be classified as mostly or completely rural.28 By contrast, in the top 10 percent of counties in terms of attainment, just 16 percent are rural. Communities with low attainment are most heavily concentrated in the Southern United States, running from the borders of Texas and Oklahoma to the Atlantic Ocean.
About 21 million adults without a college degree live in rural counties.29 Making headway on educational attainment in these communities is important. Poverty rates in rural places are higher than they are on average and, in particular, affect those without a college degree. Though 26.4 percent of people without a high school diploma live in poverty, that rate declines to 14.1 percent for those with a high school diploma, cuts down to 10.2 percent for those with some college or an associate degree, and drops to 4.5 percent for those with at least a bachelor’s degree.30 Though a degree is not a surefire way out of poverty, it does play a significant role in reducing the likelihood that adults will face that outcome.
Why is attainment so low in rural counties? Certainly, in some cases, these areas lack access to postsecondary options. Geography is a key factor in college attendance, as 56 percent of students at public four-year colleges grew up less than 50 miles from their campus, and the median community college student travels eight miles to get to school.31 As it so happens, rural counties are home to just 14 percent of the nation’s college campuses, even though these areas cover 97 percent of U.S. land area.32 Furthermore, disparities exist between well-resourced flagships and lower-resourced regional and community colleges, which tend to be the only ones in rural areas. Past research has dubbed these areas “education deserts,” defined as commuting zones that lack more than one broad-access postsecondary option.33
Without a college nearby, adults in these communities—particularly those living in poverty—must rely on low-skilled work or on training provided by an employer. Children in these communities may not see postsecondary education as an option, making earning a degree an unlikely proposition and perpetuating the cycle of poverty. Add to this the mounting challenges associated with accessing higher education, such as increasing costs and reduced purchasing power of federal grants, and people in these communities are left to rely on industries in which worker power has declined and wages have stagnated.
Although online postsecondary options exist, they are not a viable answer for most Americans. Studies have shown that online education reduces GPAs and increases the risk of dropping out, especially for students who are underprepared for college-level coursework.34 Many Americans also lack internet access; only about 63 percent of people in rural areas have broadband internet access in their homes, compared with 75 percent of people in urban locales.35 And for those interested in skilled trades, online education also is not feasible, as a primary component of such programs is hands-on experience. Although some online options, such as Southern New Hampshire University, have built online programs geared toward returning students, it may be difficult for adults who have been out of school for years to commit to a virtual classroom, particularly if they are still working and caring for a family.
Nye County, Nevada, provides a case study for the challenging choices that Americans living in rural areas face when making postsecondary decisions.
Case Study: Nye County, Nevada
Nevada stands out from other states, in part because it has very large counties, but also because it has such a sparse distribution of colleges. Though Nye is the third-largest county by square mileage in the United States—and two times the size of New Hampshire—it is home to just one school, a community college campus that rests in the county’s southernmost tip.
Nevada was the last state to set up a community college system.36 In 1967, residents raised funds to open Elko Community College, the first institution and the main campus of what is now known as Great Basin College (GBC). One of the primary challenges for GBC is reaching Nevada’s rural residents. Much of the state—and most of Nye County—is considered unpopulated, and hundreds of miles can separate one community from another.37
Nye covers twice the area of New Hampshire but is home to 33,000 adults and just one college campus.
GBC has attempted to expand its reach into more rural areas of the state by leveraging technology. It aims to fill the void of postsecondary availability by offering several fully online programs—including bachelor’s degrees, such as its Bachelor of Science in nursing program—but most of the school’s offerings are only available with at least some in-person attendance. Prospective students in rural locations who are interested in these programs can request that classes be offered locally via interactive video.38
But this model is not ideal. The campus location in Nye County—the Pahrump Valley Center—is responsible for administering classes in seven locations around Nye and neighboring Esmeralda counties, six of which are more than two hours from campus. Interactive video courses are not offered for all classes and programs and are only run “as the need arises.”39 Furthermore, the programs that offer interactive video are not listed on GBC’s website. These remote options may also not be conducive to completion, as only 28 percent of GBC’s students complete or transfer within eight years of enrolling, compared with 53 percent at community colleges nationally.40
Racial and ethnic gaps in bachelor’s degree attainment
At first glance, it may seem like urban areas do not have an attainment problem. Of the top 100 U.S. counties in terms of attainment, 93 are urban or suburban.41 The population of bachelor’s degree-holders in urban counties is five times greater than the total population of all completely rural counties. And U.S. counties with more than 100,000 people are home to about 72 percent of the country’s adults and 80 percent of people with at least a bachelor’s degree.
Despite the high overall rates of attainment, urban areas have a distressing problem: High-attainment counties are also home to some of the largest racial and ethnic attainment gaps in the country. The concentration of highly educated people obscures the low attainment rates of many within their communities—mostly people of color and, in particular, black and Latinx Americans.
Though significant racial and ethnic gaps exist throughout the country, they are largest in urban areas. In the counties with the worst attainment gaps,42 97 percent of adults live in urban areas, including those that house New York City (56 percentage point gap); Denver (47 percentage point gap); San Francisco (44 percentage point gap); Boston (42 percentage point gap); Atlanta (41 percentage point gap); Los Angeles (35 percentage point gap); and Chicago (32 percentage point gap).43
Large racial and ethnic gaps also exist in college towns—particularly those that house flagship campuses. This includes the counties that boast the University of Virginia (50 percentage point gap); the University of Colorado Boulder (40 percentage point gap); the University of Texas at Austin (37 percentage point gap); and the University of California, Berkeley (36 percentage point gap). High attainment rates in these places are not driven by students, as most are not over the age of 25. Rather, these colleges tend to be large employers, and faculty and staff very often are white bachelor’s and graduate degree-holders.
It is not a shortage of nearby campuses that limits access to higher education in certain urban communities. Urban areas are home to nearly 8,500 college campuses, 66 percent of the total number of campuses nationwide.44 But historical inequities, poor access to high-quality institutions, and migration, among many other issues, play a role in limiting postsecondary opportunities to people of color. As a result of these inequities, black households hold significantly less wealth than their white counterparts, even after accounting for education, marital status, age, and income level.45
Case Study: Washington, D.C.
The nation’s capital is a prime example of racial inequality in educational attainment. In Washington, D.C., there are more black-identifying adults than white, non-Hispanic adults—about 216,000 compared with 189,000.46 Washington also has one of the highest rates of degree attainment in the nation, with 57 percent of adults holding at least a bachelor’s degree, including 33 percent with a graduate degree. While nationally, there is slightly less than one adult with a graduate degree for every one adult without a high school diploma, in Washington, there are 3.3 people with a graduate degree for every high school dropout.
But the D.C. residents with degrees are largely white; three times as many white adults as black adults hold a bachelor’s degree or higher, a 66 percentage point attainment gap.
In Washington, D.C., 91 percent of white adults have a college degree, but only 29 percent of underrepresented adults do.
Those without a degree have not shared in the economic boom that has occurred in the district over the past decade. This is in part due to the huge influx of college-educated young adults into the district, most of whom are white. Though Washington was 70 percent black in 1970, that presence has eroded due to such gentrification.47 The differences between the college haves and have-nots is stark; one-third of residents without a high school diploma live in poverty compared with 6 percent of those with a bachelor’s degree.48 And those without a college degree are largely concentrated in Wards 7 and 8, where 46 percent of the district’s black or African American population lives.49
Washington also has extremely low access to affordable colleges, especially those that are open enrollment—meaning they allow students to be admitted based on limited criteria. The only public institution within city limits, the University of the District of Columbia, enrolls fewer than 5,000 students every year,50 and the district spends just 1 percent of its local funds budget on the school.51 Nationwide, the average rate is 5.8 percent.
Case Study: Hialeah, Florida
Some cities may be home to a lot of colleges, but access to high-quality institutions is another story entirely. Hialeah, Florida, a city that borders Miami, boasts a distressing statistic: 17 of its 18 college campuses are for-profits. Though this high concentration of for-profits is not common, Hialeah is not alone. More than half of the colleges in Anaheim, California; Austin, Texas; Baton Rouge, Louisiana; and Tempe, Arizona, among other large metropolitan areas, are proprietary, or for-profit, institutions.52
The proliferation of for-profit colleges raises serious concerns for the residents of Hialeah, more than 95 percent of whom are Hispanic or Latinx.53 Though not all for-profit colleges are of low quality, for years these schools have skirted federal rules and provided students with worse returns than similar programs at community colleges.54 And the data for Hialeah’s college outcomes do not look good. Twenty-five programs offered by for-profit colleges in Hialeah have been evaluated under the gainful employment rule, which measures the debt-to-income ratio of students who complete certain programs. Of programs for which data are available, only 12 passed and just three produced graduates with median earnings of more than $30,000.55
Of the 18 colleges in Hialeah, Florida, 17 are for-profit.
Though Miami Dade College, Hialeah’s lone campus that is not a for-profit college, was recently named one of the best community colleges in the country,56 students may instead be lured by flashy advertising and names that sound prestigious or resemble those of public colleges in Florida. For example, Hialeah is home to the for-profit, two-year Florida National University, which has an average annual cost that is about $7,000 more than the public, four-year Florida International University, whose campus is just 12 miles away.57 Simply put, the noise created by for-profits may drown out consideration of better options.
Furthermore, time and ease are major considerations for adult learners, and for-profits tend to play into these concerns. Even though the for-profit programs in Hialeah largely prove to be of low value, many of these schools promise a quick path to a credential, which can be very tempting for low-income adults contending with stagnant wages and a high cost of living.58
Recommendations: Steps for federal, state, and local leaders
This research highlights just how important place-based postsecondary and workforce development policies are in the United States. No one solution can address college access and attainment, and these issues are never cut and dried. For example, rural America is commonly perceived as mostly white—and indeed, 94 percent of rural counties do have a white majority. However, there are still 120 rural counties, mostly concentrated in the Southern United States, with a majority-minority population.59
Deep, systemic inequities have long pushed people of color out of postsecondary education. For centuries, black, Latinx, and Native Americans were largely excluded from higher education, leaving them without the ability to build the wealth and institutional legacies that currently benefit many white families. The children of people of color disproportionately enroll in K-12 schools with fewer resources and poorer outcomes than those in high-income districts, meaning these students leave school less prepared for college. And even when they do enroll, the majority of underrepresented students enroll at community colleges and minority-serving institutions, where states spend approximately $5 billion less per year educating them relative to their white peers.60
Even though the returns of a college degree are not the same for people of color as they are for white people, a college education—in particular, a bachelor’s degree—provides one of the best, and only, tools for adults to build a better future for themselves and their children.
Overcoming barriers to college attainment also requires supporting the success of all students—not just those who are straight out of high school and attending full time, or those who borrowed for a bachelor’s or graduate degree. If policymakers are looking to reduce reliance on means-tested benefits and improve overall economic prosperity, they would do well to better support educational options for adults, especially those who have dropped out of high school or college.
While the federal government needs to do much more to support access to high-quality higher education, progress ultimately requires a community effort, involving states, colleges, local government, employers, and community leaders. This local engagement is crucial to overcoming challenges related to college access and funding in order to make a significant, positive impact for today’s workforce and future generations.
States and localities
Behind the federal government, states are responsible for providing Americans with affordable higher education spanning nonselective to elite colleges. Local governments can also play a significant role in bringing in and keeping postsecondary institutions for their residents.
The role of state government
States play an important role in crafting postsecondary education systems. In particular, they are a crucial partner in any effort to adequately fund postsecondary education. Though state spending on higher education has rebounded since the Great Recession, appropriations have only recovered halfway since 2008.61 As a result, students in community and regional comprehensive colleges receive less support—a disparity disproportionately affecting students of color, who overwhelmingly enroll on these campuses.62
Part of the challenge of increasing state spending for higher education is that there is not enough revenue to go around. As state costs increase and many states slash taxes, funding for postsecondary education is often the balancing factor in state budgets. Some states, such as Tennessee, have taken to using state lottery funds to boost funding for postsecondary initiatives, but these programs tend to be regressive, with lower-income state residents footing a disproportionate portion of the bill.63 States interested in raising funds to make college more affordable for students may need to raise state income, property, or business taxes, or change laws to permit local levies for community colleges, which is only allowed in 29 states.64
Though states must better fund their institutions and students, they also need to address the role that geography plays in their residents’ access to higher education. Community and regional colleges serve the majority of rural residents, and these institutions have fewer resources to adequately address the challenges they face in reaching students of color and rural students. State legislatures must look at shifting more funding toward these colleges and developing strategies to reach every family in the state, rather than focusing on funding the state flagship.
States could also reorganize their higher education systems to create efficiency and promote access to high-quality postsecondary options in low-attainment areas. Though some states already have tighter control of colleges, others have taken steps to create systems that consolidate independently run colleges in order to reduce costs and better align program offerings. For example, the head of the public higher education system in Connecticut has proposed consolidating the state’s 12 community colleges, with a projected annual savings of $28 million.65 Though this plan is controversial, changes like these could produce cost savings that can be used for a variety of purposes, such as creating additional locations for rural students or boosting revenues that have lagged due to state disinvestment.
Finally, states must compel employers to contribute to the training of employees. Though community colleges have increasingly partnered with local employers to develop programs that train workers for higher-skilled jobs, companies have also disinvested in on-the-job training.66 Particularly in areas with low access to postsecondary education, employers are important players in improving the prospects of residents who may not have anywhere else to turn for an economic boost. Simply put, states must ensure that employers are on the hook for training and partnership opportunities, rather than expecting community colleges to pick up the slack.
The role of local government
Though some colleges, such as Ivy Tech in Indiana, have made a point of expanding options to students in rural areas, sometimes the state fails to provide enough resources to keep those locations open.67 In these cases, local governments can step in. For instance, with Ivy Tech, mayors in rural locales opted to subsidize the cost of rent for nearby college locations, rather than having their residents lose access to postsecondary options.
Cities can also work to improve access to college. The original “free college,” or Promise program, in Kalamazoo, Michigan, was funded through private philanthropic dollars and has resulted in a 23 percent increase in four-year college enrollment rates and a 28 percent increase in six-year college graduation rates; moreover, it was shown to have a proportionally greater impact on students of color.68 Programs that provide intensive, wrap-around supports for students also deserve consideration. City University of New York’s much-studied Accelerated Study in Associate Programs (ASAP) initiative has doubled graduation rates for participating students and reduced the cost per degree for the college.69 Though such effective initiatives can be expensive, they are worth the cost in the long run, as increasing degree completion leads to increased economic activity as well as tax revenue.70
Federal government
Though states and communities are often the proving ground for innovative postsecondary initiatives, the federal government must make major investments in postsecondary education. First, it can push expansive affordability proposals that compel states to invest in colleges and their students. Proposals such as the Center for American Progress’ Beyond Tuition and laws such as the Debt-Free College Act of 2019 would provide students with substantial funds to pay for the cost of attending college via a federal-state partnership.71 These programs would ensure that students have the necessary resources to attend college and that states provide sustained investments in their postsecondary systems. Without such large-scale, equity-minded reforms, it is difficult to imagine a world where attainment gaps close significantly.
The federal government can also step in to reduce disparities in attainment rates. In areas that have long been economically disadvantaged, the federal government can assist states in developing plans to get their economies back on track. It can also take action against states that create policies that exacerbate inequities, particularly for people of color, such as those that spend significantly less on schools where these students tend to enroll.72
The federal government can also ensure that colleges are providing high-quality credentials to their students. The recent closures of massive for-profit college chains, such as ITT Technical Institute and Argosy University, illustrate the devastating failure of the gatekeeping mechanisms in the U.S. postsecondary system, which are intended to keep out bad actors. High default rates for certificate programs, as well as high debt-to-income ratios across a variety of credentials, should give pause to those who claim that certificates are the answer to this nation’s college affordability and completion challenges. Instead of pursuing proposals that would rapidly open up poor-performing programs to federal aid—for instance, by providing Pell Grants to short-term programs—policymakers should instead consider reforming how programs are vetted in order to ensure that students are not being shortchanged by opportunistic organizations looking to make a quick buck.
Policymakers in Congress must also consider ways to buoy workers’ rights to ensure that all Americans can access a well-paying job, even if they do not have a degree. Programs like those recommended under CAP’s Blueprint for the 21st Century, which include a $15 minimum wage, major investments in infrastructure, and increases to workers’ bargaining power, would go a long way toward helping Americans everywhere find success.73
Conclusion
Postsecondary education should be one of the answers to poverty in the United States, but it should by no means be the only one. Policies that recognize and correct for historical injustices, such as redlining, as well as current ones, such as overdevelopment, must be considered in order to break the cycles that hold back too many Americans. Increasing attainment in rural areas should not lead to fears of brain drain; rather, well-paying jobs for those with and without degrees should exist outside of urban areas. Moreover, ameliorating racial disparities should be met with an enthusiasm for building a better future for all Americans, not just those who have always had a leg up. The solutions are by no means simple, but investment in quality education at all levels and worker-focused economic development can lead to sustained, equitable growth in the United States.
About the author
Colleen Campbell is the director for Postsecondary Education at the Center for American Progress. Campbell began her career as a financial aid administrator and primarily engages in policy work focused on federal student aid, community colleges, and promoting equitable outcomes in postsecondary education. She holds multiple degrees from the University of Michigan, including a Master of Public Policy from the Gerald R. Ford School and a Master of Arts in higher education from the Center for the Study of Higher and Postsecondary Education.
Methodology
All attainment data are from the U.S. Census Bureau’s 2013–2017 American Community Survey five-year sample, which provides the only estimates of degree attainment by race for every county in the United States. Data are from tables “S1501” and “S1701.” Due to the definitions of race and ethnicity and aggregation across races, some underrepresented minorities may be double-counted if they identify as Latinx as well as black or African American, Native, or Pacific Islander. Furthermore, degree attainment is defined as an associate degree or higher for national data but is only available for bachelor’s degrees or higher within racial and ethnic categories. Certificate data are not collected by the Census Bureau.
Colleges were identified using data from the U.S. Department of Education’s Postsecondary Education Participants System (PEPS), which registers every campus that participates in the federal financial aid programs. These data provide a more comprehensive list of colleges than do other federal sources, such as the Integrated Postsecondary Education Data System (IPEDS), because they are administrative rather than self-reported by the college. Thus, PEPS contains data for each campus authorized to offer programs under the federal financial aid programs, whereas colleges can choose how to aggregate and report data in IPEDS.
However, PEPS also offers challenges. Colleges may shut down a campus but not report its closure to the Department of Education, or the campus may only offer programs intermittently. Some locations may only offer one program, and some programs may be restricted to individuals working for a certain employer. Therefore, determining what a college campus is, and locating it on a map, is not as straightforward as one may assume.
In order to highlight campuses and locations that were not operating or that may not offer several programs to the public, the author strove to remove all officially closed campuses; graduate-only institutions; high school, corporate, hospital, and church-based programs; institutes within colleges; and seminaries from the list. The map also excludes colleges that do not participate in the federal financial aid programs, including the military academies. In spite of systematic attempts to accurately identify college locations, the map likely contains defunct campuses that are not officially closed or those that only offer a few programs. It may also exclude colleges that are currently operating. The colleges on the map are likely an overrepresentation of campuses in the United States, and more work must be done to create a definitive list of college locations, and to typify the different types of college campuses.
Institutional statistics are from IPEDS. Due to variations in available data, some of the statistics reported are aggregated across multiple campuses while others are just for an individual campus. A college’s sector is determined by its institutional category, rather than its reported sector in IPEDS.