This report contains corrections.
Introduction and summary
How bad are school vouchers for students? Far worse than most people imagine. Indeed, according to the analysis conducted by the authors of this report, the use of school vouchers—which provide families with public dollars to spend on private schools—is equivalent to missing out on more than one-third of a year of classroom learning. In other words, this analysis found that the overall effect of the D.C. voucher program on students is the same as missing 68 days of school.
This analysis builds on a large body of voucher program evaluations in Louisiana, Indiana, Ohio, and Washington, D.C., all of which show that students attending participating private schools perform significantly worse than their peers in public schools—especially in math.1 A recent, rigorous evaluation of the D.C. Opportunity Scholarship Program from the U.S. Department of Education reaffirms these findings, reporting that D.C. students attending voucher schools performed significantly worse than they would have in their original public school.2
The analysis is timely given President Donald Trump and Education Secretary Betsy DeVos’ main education priority: to privatize education by creating and expanding voucher programs nationwide. In the Trump budget released in February, the president has suggested doubling investment in vouchers.3* But while President Trump and Secretary DeVos often assert that research backs their proposals, the evidence is lacking.
In order to add necessary context to the recent voucher research—and the debate over the budget—the authors compare the negative outcomes of one of these voucher programs—the D.C. Opportunity Scholarship Program—to other factors that negatively affect student achievement. That analysis also finds that the effect of vouchers on student achievement is larger than the following in-school factors: exposure to violent crime at school, feeling unsafe in school, high teacher turnover, and teacher absenteeism.4
To be clear, the far-reaching negative effects of factors such as feeling unsafe in school cannot be overstated. For example, there is a large body of work that discusses the negative impact of exposure to violent crime on children’s well-being, including academic performance.5 Certainly, many of these factors are serious and are known to have a negative impact on multiple areas of child development. However, the comparisons made in this report focus only on how each in-school factor—violence at school, feeling unsafe, teacher turnover, and teacher absenteeism—affects school achievement.
Further, using the Center for Research on Education Outcomes (CREDO) formula, the authors of this report also found that the overall effect of the D.C. voucher program on students is the equivalent of 68 fewer days of schooling than they otherwise would have received had they remained in their traditional public school. In other words, the students who participated in the D.C. voucher program lost more than one-third of a year of learning.6 To be clear, translating this effect into days of learning is an approximation intended to help assess relative impact. In this case, 68 days lost is clearly substantial lost ground for students participating in the D.C. voucher program.
Importantly, the authors’ comparisons rely on both a selection of rigorous, recent voucher studies with test score impacts and one rigorous quasi-experimental study for each comparison topic. That being said, using alternative studies could lead to different results. The methods for selecting both specific voucher studies and comparison studies to add context are detailed in this report’s Appendix. Finally, the evaluation of the D.C. voucher program so far assesses one year of achievement data and future findings may be different. However, these findings are very similar to those from other longer-term voucher studies, which are described in this report.
Caveats aside, the negative achievement outcomes of voucher programs uncovered by recent studies have not deterred the Trump administration;7 its stance on vouchers exemplifies a larger tendency to a dismiss evidence that does not align with the administration’s priorities.8 This dismissal of evidence plays an unfortunate role in both undermining the nation’s public schools and confusing parents who seek access to high-quality public school options.
An overview of recent voucher research
Earlier studies of voucher programs appeared to show some promise. Many of those evaluations—in New York City, Dayton, Ohio, and Washington, D.C., as well as in the states of Florida, Minnesota, and Louisiana—reported a modest increase or neutral impact on student achievement and graduation rates.9 The findings of some of these studies, however, have more recently been called into question as methodological flaws were discovered when adding additional years or replicating the study.10 As a result, recent voucher program evaluations employ more rigorous research methods such as experimental and quasi-experimental designs and refine their use of certain variables. These design changes and data additions allow for more stable and definitive interpretations of the results.
More recent evaluations of voucher programs in three states—Indiana, Louisiana, and Ohio—have all come to similar conclusions and show that voucher programs have negative or neutral effects on student achievement.11 Importantly, all impacts described in this report are relative to public schools. Unlike other experimental designs where participants may receive a placebo or the intended intervention, the intervention in these cases is a private school voucher and the comparison is a traditional public school. Therefore, on the whole, these results show that relative to their peers in public schools, students in voucher programs are losing ground.
The latest evaluation examined the outcomes of students using vouchers in Indiana for two, three, or four years between the 2011-12 and 2014-15 school years. The Indiana study has the largest sample size—and the largest voucher program—across all studies examined in this report. More than 34,000 Indiana students received vouchers in the 2016-17 school year.12 The study used a matching methodology to compare the test scores of students who transferred to participating voucher schools with similar students who remained in public schools. It found that students who used vouchers did not see academic gains in their new schools and that they performed worse, on average, than their matched peers in the public schools that they left.
Notably, the study also found variation in voucher impacts depending on the sample of students investigated and how long those students stayed in the program—those who stayed longer experienced fewer negative impacts than those who only stayed for two years. However, in English language arts, students with disabilities in voucher programs experience an average learning loss each year when compared with students without special education identification.13
The most recent evaluation of the Louisiana voucher program, from the 2011-12 to 2013-14 school years, also showed a negative impact.14 The Louisiana program expanded statewide in 2012 after serving only students in New Orleans since 2008.15 In the 2015-16 school year, the program served more than 7,000 students.16 Using an experimental design, the evaluation found that, on average, participating voucher students’ performance in both reading and math dropped for two years and then, according to one model with a restricted sample size, saw performance rebound to end up remaining somewhat level to public school students’ performance in math after three years.17 However, the using an expanded sample size, the second model in the same paper found that student performance after three years continued to suffer from negative impacts. Ultimately, the model showing continued negative performance is more relevant and accurate, as it is based on a substantially larger sample size. Other researchers agree and assert that the continued negative findings across all three years are the most accurate results to highlight.18
The Louisiana findings are significant and show declines that are the equivalent of the average math student—at the 50th percentile—dropping to the 34th percentile after three years of participation in the Louisiana voucher program. The researchers of this evaluation find that this large effect is driven by even larger significant, negative effects for students who started in earlier grades—first through third grades—and somewhat smaller nonsignificant, negative effects for students who started in later grades: fourth through sixth.19
Researchers have studied vouchers in Ohio as well. Also a statewide program, Ohio gave vouchers to more than 18,000 students in the 2013-14 school year.20 The state has since expanded the program to grant vouchers to up to 60,000 qualifying students.21 Unlike other voucher programs, the Ohio program is targeted to only students attending low-performing public schools. The findings in Ohio, which used a quasi-experimental design and compared students who are similar across a multitude of factors, are similarly negative for students in math and reading after attending a voucher school. This study is the only one out of the four voucher programs recently evaluated that finds significant negative impacts in both math and reading.22
In addition to these four state-based studies of voucher program impacts on test scores, some recent studies do show positive effects on graduation rates, parent satisfaction, community college enrollment, and other nonachievement-based outcomes, but it is unclear if these outcomes are lasting and valid.23 For example, research shows that nationally, graduation rates for students in public schools and peers participating in voucher programs equalize after adjusting for extended graduation rates.24 Some critics suggest that private schools may graduate students who have not successfully completed the full program.25 Also, in regard to parent satisfaction, while some studies do show greater satisfaction among parents whose children participate in voucher programs, the most recent evaluation of the D.C. voucher program shows that any increase in parent or student school satisfaction is not statistically significant.26
Finally, there is some evidence that the performance of students in public schools increased after the creation of voucher programs—as was the case in Florida and Ohio during the implementation of voucher programs in those states.27 However, it is unclear why these modest increases occurred.28 Nonetheless, these recent rigorous voucher evaluations showing substantive academic losses for students who do participate in voucher programs serve as a heavy counterpoint to these modest results for students remaining in public schools.
D.C. Opportunity Scholarship Program and student achievement
This paper focuses on the most recent evaluation of the D.C. Opportunity Scholarship Program, which is the only voucher program funded and authorized by federal law and uses a randomized control trial design.29
Enacted in 2004, the D.C. voucher program provides publicly funded vouchers for low-income families who have a school-age child and reside in Washington, D.C. Eligible families receive vouchers through a lottery process. Families can enter the lottery if they meet program eligibility—D.C. residency and a household income at or below 185 percent of the federal poverty line. The district gives priority based on a few factors, including attendance in a low-performing public school and siblings in the program. If a student is selected, the family can apply and enroll in private school or decline and remain in a public school.30 About 70 percent of families who are offered a voucher choose to enroll in a private school.31 The D.C. voucher program accepts about 600 students per year.32 Once you receive a voucher through the lottery, you are eligible to continue with the program until graduating high school.
Vouchers grant up to $8,653 for elementary and middle school annual tuition, and up to $12,981 for high school tuition.33 If the tuition or other fees exceeds the voucher amount, parents must cover the difference.34
In the spring of 2017, the Institute of Education Sciences (IES), the independent research arm of the Education Department, published a study that found that D.C. students who used a voucher scored 0.12 standard deviations lower in math than students who were not offered a voucher and remained in a public school.35 The evaluation assessed the outcomes of students from the 2012, 2013, and 2014 lotteries. This 0.12 score drop is the equivalent of an average student in the 50th percentile dropping to the 45th percentile after participating in the D.C. voucher program for one year.36 According to the IES study, participating in the D.C. voucher program had no statistically significant effect on reading achievement.37
These results mean that in math,38 the 1,166 participating voucher students fell behind their peers who remained in public schools, despite an annual federal investment of $60 million in the D.C. voucher program. Both groups of students performed similarly in reading.39 Notably, this study only analyzes one year of impact data; however, the results are in sync with the recent longer-term findings discussed above in Louisiana, Indiana, and Ohio.
IES’s study of the D.C. voucher program is an important addition to existing voucher research. While there are voucher programs available in 13 other states,40 the D.C. Opportunity Scholarship Program is the only voucher program with a congressionally mandated evaluation.41 IES worked in partnership with Washington, D.C., to structure the voucher program as a randomized controlled trial so that researchers could use the most rigorous scientific research method—an experimental design—to evaluate outcomes.42 Researchers call experimental designs the gold standard because they leverage random, lottery-based assignment of students to either the treatment or control group—voucher schools or public schools, respectively—to more accurately assess the difference between the two groups of students.43 While these types of studies can be more expensive and cumbersome to implement, they largely provide methodologically unassailable results.
A week after IES published the evaluation, which reported the negative effects of the D.C. voucher program, the Republican-led Congress passed a bipartisan budget deal with a prohibition to the use of the experimental design evaluation method in any future federally funded studies of the D.C. voucher program.44 Instead, IES must use “an acceptable quasi-experimental research design.”45
This change does not affect the ongoing D.C. voucher evaluations that are already in progress—namely, to explore the long-term effects of D.C. vouchers, including graduation rates. All future evaluations of the federally funded D.C. voucher program will therefore employ methodologies with more limitations, making it more difficult to definitively interpret results. As a consequence, the findings of the most recent evaluation of the D.C. voucher program using the experimental method is now even more important to consider in the ongoing voucher program debate.
Explaining the negative impacts of voucher programs
The authors of all four recent voucher studies—in Washington, D.C., Louisiana, Indiana, and Ohio—have suggested some theories for the decline in student achievement, such as capacity and loss of instructional time.
The researchers in the district tested three theories about the negative impacts and found that only one of them may explain some of the learning loss experienced in voucher schools.46 More specifically, they investigated the possibilities that control group students were in higher-performing public schools; that voucher schools continue to offer less instructional time than public schools; and finally, that student mobility—the fact that a student is moving and adjusting to a new school—may be the underlying cause of the negative impact.47
Of these three, only the instructional time factor proved to be a likely cause. As in the 2010 evaluation, the researchers found that private schools offer less instructional time than public schools. On average, private schools offer 65.5 minutes less per week in reading instruction and 48.3 minutes less per week in math instruction.48 More quality instructional time is linked to higher student achievement.49 Therefore, with each additional year that students are enrolled in the voucher program, they lose even more instructional time.
In Indiana, Louisiana, and Ohio, researchers speculated that participating private schools may lack the immediate capacity and resources to educate students who are academically behind, who are English-language learners, or who have disabilities.50 This potential lack of capacity is of particular concern for the participating populations in all four contexts, because the students who tend to use vouchers are more likely to be behind academically. In Indiana, they are also more likely to be English-language learners.51
Finally, many public schools who lost students to vouchers are on an upward performance trajectory.52 Therefore, part of the learning loss experienced by voucher students compared with the learning of their public school peers could be attributable to the fact that those public schools are on an upward performance trajectory. This is consistent with a recent study that found, on average, that over the past two decades, public schools’ performance has caught up to or exceeded the performance of private schools.53
Making sense of vouchers’ effect on student achievement
To put the negative effects of vouchers in perspective, the authors of this report compared the effect of the D.C. voucher program on student achievement in math with the effects of other negative in-school factors—feeling unsafe in school, violent crime at school, teacher turnover, and teacher absenteeism.54 Beyond school, the authors even found that vouchers have a greater negative impact on student achievement than smoking, according to one study. While this context is compelling, comparing and understanding the impacts of smoking are beyond the scope of this analysis.55
As part of the study, the authors show each negative impact as the equivalent of a specific drop for a student who was average in math—in the 50th percentile—to a lower rank in the same distribution. This conversion uses the effect size—in the case of the D.C. voucher program, -0.12 standard deviations—to find the equivalent percentile drop from the 50th percentile on a normal curve.56
The comparable results are meaningful and startling. The impact of attending a participating D.C. voucher school on math achievement is a larger decrease than all other factors that the authors reviewed. A public school student who is average in math—in the 50th percentile—declines to the 45th percentile after participating in the D.C. voucher program for one year.
An average math student who experiences high teacher turnover drops from the 50th percentile to the 48th. Feeling unsafe in school, experiencing at least 10 teacher absences, and exposure to school crime have the same equivalent effect, dropping to the 49th percentile.
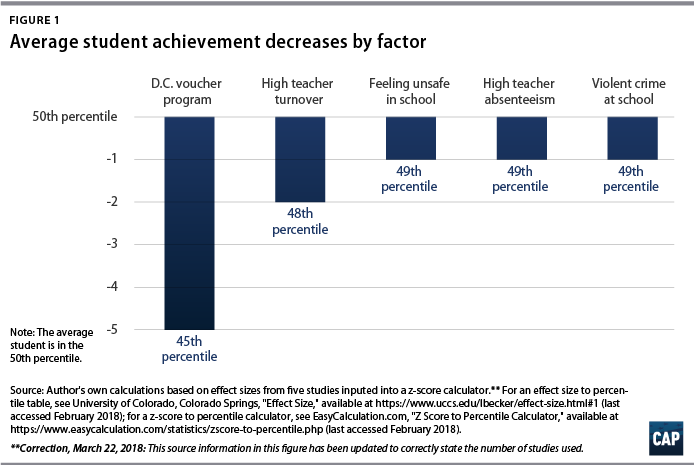
A decline in percentile points means that students are substantially falling behind relative to their performance in public school or relative to their similar public school peers, depending on the study. All the losses associated with these different detrimental interventions are significant. And yet, this comparison shows that students attending a voucher school experienced the largest relative learning loss across all five studies of negative impacts.
Further, using CREDO’s days of learning conversion, this standard deviation unit decrease is the equivalent of losing 68 days of learning—more than one-third of an entire school year.57 This conversion assumes that students learn, on average, the equivalent of one-quarter of a standard deviation unit—0.25—per year.
It is important to note that each study that the authors used only evaluates the impact of one factor in student achievement, when in reality, students are exposed to a variety of environmental and other factors, many of which have the potential to affect test scores. Therefore, it is possible—and likely—that students are exposed to more than one of the negative factors. For example, a student who witnesses violence in school may also feel unsafe in school. Further, when comparing these effects with the impact of participating in a voucher programs, it is also possible that students in both public schools and voucher programs experience additional impacts from some of the factors described in these comparison studies. However, there is no overwhelming evidence that would suggest bias in this comparison; there is no reason to believe that these known factors—teacher turnover, absenteeism, feeling unsafe in school, and exposure to violent crime at school— would occur more in the private sector versus the public sector or vice versa58.
As noted above, this analysis uses only one rigorous, well-regarded study on each topic. Therefore, using alternative studies could lead to different results. The methods for selecting both specific voucher studies and comparison studies to add context are detailed in the Appendix. Selection criteria included rigorous methods, recent results, and studies that are representative of their field. The statistical significance; negative or positive sign direction; and magnitude are similar to other rigorous studies addressing these topic areas. In some cases, other similar studies may find an effect in reading but not in math, for example, but maintained the same sign, as well as similar significance and magnitude. This comparison focuses on math impacts only to allow for an aligned analysis of effects. Further, the evaluation of the D.C. voucher program only assessed one year of achievement data; however, these are similar to the longer-term impacts found in the other three recent rigorous studies compared here.
Ultimately, this comparison shows that the negative impact of the D.C. voucher program exceeds the impact of other factors which society deems harmful.
The response of voucher advocates
The wave of voucher studies with negative findings in recent years have put some advocates in a bind. As studies consistently show negative outcomes, voucher proponents have backtracked or tried to spin the findings. For example, many voucher proponents point to other measures of voucher effectiveness, such as increased parent satisfaction.59 The U.S. Conference of Catholic Bishops, a strong proponent for expanding voucher programs as a way to increase enrollment in parochial schools, wrote in a letter to Sen. Marco Rubio (R-FL) and Rep. Todd Rokita (R-IN) that “parental surveys, the number of families renewing scholarships, student graduation and matriculation, and basic accounting requirements, for example, are sufficient to assess and maintain the integrity of the program.”60
However, parent satisfaction is an especially slippery metric, as participating voucher schools often do not follow the same accountability and transparency parameters required of public schools. Private schools may not administer standardized assessments and, therefore, parents may lack comprehensive information to assess how their children are performing compared with statewide, grade-level standards.61 Furthermore, a recent study in the National Bureau of Economic Research found that parents struggle to select effective schools.62
While all reported successes of voucher programs should be further explored, including impact on graduation and college attendance rates, this research does not discount their significant troubling effect on student achievement. Statements such of that of the U.S. Conference of Catholic Bishops show that many voucher advocates recognize that using achievement to evaluate the worth of voucher programs would likely hurt their potential for growth. Rather than addressing the root of the problem—voucher programs leading to large student achievement declines—proponents hope to sweep the issue under the rug.
President Trump and Secretary DeVos take a similar stance. DeVos repeatedly refused to commit to holding private schools that accept public dollars to any accountability provisions, including those that would ensure that schools report student achievement outcomes and even the most basic information on school enrollment.63
Importantly, even if schools do report student achievement results, researchers, policymakers, and parents will find it difficult to compare students’ performance in public versus private schools unless states also decide to require private schools to administer the same tests to both public and private students.64 It seems unlikely that this will change as voucher programs expand, particularly since equal accountability is deemed unimportant by the education secretary.65
Conclusion
Boosting student achievement is vital for America’s future.66 Raising outcomes in the nation’s school system will both maximize the potential of every child and foster the skills of tomorrow’s workforce. While choice in the education sector can spur innovation and offer parents and children options to best meet individualized needs, evidence indicates that voucher programs do not improve results for students and will not achieve that aim. Indeed, vouchers will likely hurt student growth and lower overall outcomes.67 Moreover, as low-performing and low-income students are often overrepresented in voucher programs,68 students with the greatest need will likely experience preventable declines in student achievement.
Looking forward, the federal government should focus its funding and influence on research-based education policies that have been shown to improve academic achievement. Encouraging the replication of high-performing charter schools, expanding access to high-quality pre-K programs, or increasing the equitable distribution of teachers are all much better and proven educational investments.69
Unfortunately, President Trump and Secretary DeVos instead aim to divert public funding to fuel the expansion of voucher programs.70 If evidence indicates that vouchers are worse for students than many other factors that society believes are detrimental to student growth and achievement, how can the federal government condone, let alone allocate, scarce funding resources to promote private school vouchers?
Appendix
CAP translated and compared the effect sizes of six studies in varying topic areas to provide the context needed to aid in interpreting these impacts. Importantly, two distinct processes guide the authors’ methods: study selection and converting effect sizes to percentile changes and days of learning.
Study selection
Voucher study selection
The voucher studies included in this report are the four most recent and rigorous voucher program analyses to be released in the past five years. Other work analyzing voucher program effects has similarly divided these four current studies from prior work.71 The specific focus of this brief is the study of the D.C. voucher program. The D.C. voucher program was selected as a study focus for this report due to the federal investment in the program; the federal mandate for the IES to study the impacts of the program; and the randomized control trial methodology used to investigate its impact. These three factors make the D.C. voucher program an important lens for education policymakers and practitioners to understand and use when considering investment in this program or similar programs. However, all four studies of voucher programs included in this report leverage rigorous—either experimental or quasi-experimental72—methodologies and are similarly important for education policymakers and practitioners to understand. Importantly, all four studies also have similar findings of negative impacts on math scores and in one case, on reading scores as well. These studies serve to further validate the impacts found in each individual study. This corroborating evidence is notable, as the D.C. voucher program only assessed one year of achievement data; however, the results are comparable to the other three current studies described.
Other study selection
The additional five current studies with negative educational impacts described in this report, which serve to add context to the voucher study impacts, were all selected based on four parameters: the presence of in-school factors associated with negative impacts, rigorous methods, recent results, and representative of their field—that is to say, the statistical significance; negative or positive sign direction; and magnitude are similar to other rigorous studies addressing these topic areas. In some cases, other similar studies may find an effect in reading but not in math, for example, but maintained the same sign, and similar significance and magnitude.. The comparison in this brief focuses on only math impacts to allow for a comparable analysis of effects. Importantly, this analysis uses only one rigorous, well-regarded study on each topic. Therefore, using alternative studies could lead to different results.
Effect size conversion
CREDO’s effect size conversion to days of learning
As noted in this paper, the days of learning conversion is an approximate translation, meant to add context and aid in the understanding of relative effect size.73 Unlike the actual effect size, the days of learning conversion should not be interpreted as a precise measurement of learning for policy use. Using research estimating the average growth from fourth to eighth grade on the National Assessment of Educational Progress from Eric Hanushek and Margaret Raymond, CREDO determines that one standard deviation unit of growth is the equivalent of 570 days of learning.74 Therefore, to convert effect sizes to days of learning, the effect size is simply multiplied by 570 to achieve an approximate days of learning impact. In this report, the days of learning conversion yields days lost rather than additional days of learning gained, as all the effect sizes are negative. Similarly, CREDO has also used their days of learning conversion to yield days lost when describing the impact of attending online charter schools.75
Effect size conversion to percentile change
While effect sizes are standardized and comparable, they are not always intuitive. Therefore, to provide context and aid in interpretation of important and negative voucher programs impacts, the authors translated effect sizes to specific changes from the 50th percentile. More specifically, effect sizes can be interpreted as the new percentile standing of the average control group member if they had been in the treatment group. This interpretation assumes a normal distribution where the average control group member is at the 50th percentile. For example, a treatment group effect size of 1.00 can be described as moving the average control group member from the 50th to the 84th percentile. Therefore, using readily available, online z-score calculators,76 the authors translated each negative effect size into a specific percentile drop from the 50th percentile.77
This translation to a percentile change from the 50th percentile allows the authors to make more easily understood and accurate comparisons across studies. For example, as stated in the paper, the D.C. voucher program had the average effect of moving students from the 50th to the 45th percentile, while not feeling safe in school had the average effect of moving to the 49th percentile. It is important to note, however, that the standard deviation to percentile conversion is not linear, therefore, these percentile changes must always be in reference to a starting point, in this case, the 50th percentile.
About the authors
Ulrich Boser is a senior fellow with the Center for American Progress.
Meg Benner is a senior consultant with the Center for American Progress.
Erin Roth is a senior policy analyst with the Center for American Progress.
Acknowledgements
The authors wish to acknowledge several people who helped with this report. We would like to thank Austin Nichols, principal associate at ABT Associates, Johanna Lacoe, researcher at Mathematica, and Dorothyjean Cratty, independent research consultant, who each reviewed a draft of this report and provided valuable comments that strengthened the framing and interpretations. Lindsay Bell Weixler, associate director and senior research fellow at the Education Research Alliance for New Orleans, and Terris Raiford Ross, senior director of research and support at Leadership for Educational Equity, both provided helpful methodological recommendations and input. The findings, interpretations, and conclusions expressed in this report—and any errors—are the authors’ alone.
*Correction, March 20, 2018: This report has been updated to reflect the timeline of the Trump budget released in February.