Introduction and summary
Clean water is an essential element of a healthy and productive society. Unfortunately, federal water pollution control policy is deficient in two fundamental ways. First, the federal government does not prioritize combating nonpoint source (NPS) water pollution and polluted urban runoff.1 Second, the federal government provides insufficient grant funding to state and local authorities for NPS pollution and polluted urban runoff control, choosing instead to provide the majority of federal assistance in the form of low-cost financing to municipal wastewater treatment authorities to improve point source pollution control.
Prioritizing low-cost financing for municipal wastewater point source control—while incredibly important—has allowed the problem of nonpoint source pollution and polluted urban runoff to grow over time.2 According to the U.S. Environmental Protection Agency (EPA), NPS pollution “is the leading remaining cause of water quality problems,”3 and the New Hampshire Department of Environmental Services found that about half of all water pollution comes from nonpoint sources.4 Nutrient runoff and sediment from agricultural land is the largest source of NPS pollution. According to the EPA, more than 80,000 miles of rivers and streams are labeled as impaired due to nutrient pollution.5 And this estimate certainly undercounts actual impairment, since only 31 percent of the nation’s streams are tested.6 More than 2.5 million acres of lakes, reservoirs, and ponds are impaired due to nutrient pollution.7 In addition, polluted urban runoff is the fourth-largest source of pollution for rivers and streams and the third-leading source for lakes, ponds, and reservoirs.8
Nutrient pollution often triggers major harmful algal blooms. These blooms are more than an unsightly nuisance, as the algae can produce deadly toxins that can threaten drinking water safety. Additionally, algae and other aquatic plants that thrive on excess nutrient pollution can quickly deplete their surrounding waters of dissolved oxygen, which leads to aquatic hypoxia, or dead zones of water that have insufficient dissolved oxygen to support most aquatic life.9 The EPA has identified more than 166 dead zones across the country, including in water bodies such as the Great Lakes, the Chesapeake Bay, and the Gulf of Mexico.10
Water terminology
Point source pollution. Refers to any pollution carried by water that is conveyed or passes through a pipe, ditch, channel, tunnel, conduit, or a well before entering local waters.
Nonpoint source pollution. Refers to any pollution carried by water that is not classified as a point source.
Polluted urban runoff. Refers to stormwater that flows over an urban area, carrying sediment, nutrients, and other harmful pollutants into local receiving waters. This term covers stormwater that is collected, transported, and discharged without treatment from a point source by a municipal separate storm sewer system (MS4). It also refers to stormwater that flows overland, carrying pollution directly into local waters without traveling through or along a conveyance. The latter may also be referred to as “direct drainage” or “direct stormwater discharge.”
Dead zones. Water with low levels of dissolved oxygen (hypoxic water) that causes most fish, plants, and other aquatic life to die.
Cyanobacteria. Microscopic, single-celled organisms that use sunlight to make their own food. The organisms produce harmful toxins known as cyanotoxins, which can cause rapid death by respiratory failure.
Population growth and economic development threaten to swamp the progress that states and the federal government have made on water quality since the passage of the Clean Water Act (CWA). Over the next 40 years, the Census Bureau estimates that the U.S. population will pass 400 million people.11 As the population expands, the EPA states that “the rate and impact of nitrogen and phosphorus pollution will accelerate—potentially diminishing even further our progress to date.”12
There is no comprehensive national estimate of the negative economic impacts of water pollution. However, more geographically focused studies that look at health expenditures, reduced economic productivity, and lost tourism indicate that the cost runs into the billions of dollars each year.13 For instance, a recent paper found that lost productivity and health care expenditures due to waterborne illness from recreational water activities such as swimming and boating costs the economy roughly $2.9 billion each year.14 A conservative estimate by the EPA found that tourism industry losses exceed $1 billion each year due to nutrient pollution and harmful algal blooms.15 In 2015 and 2016, harmful algae blooms devastated the Dungeness crab industry on the West Coast, causing an estimated $100 million in economic losses.16 The risks for tourism-dependent states are especially acute. For instance, more than 70 million people visit Florida each year, spending roughly $90 billion on services, entertainment, and recreation.17 A massive red tide algal bloom in 2018 along the southern Gulf Coast hit local businesses hard, resulting in $90 million in lost sales as well as reduced tax collections and layoffs.18
Table 1
The current approach to nonpoint source pollution and polluted urban runoff is insufficient to restore and maintain the chemical, physical, and biological integrity of the nation’s waters. To achieve the goals of the Clean Water Act, Congress must provide grant funding and financing to state and local authorities, as well as private landowners, commensurate with the scope of the pollution challenge. Additionally, the EPA must leverage its legal authority to push for more rapid water-quality improvements. All too often, state NPS pollution control plans are designed to avoid legal challenge by clearing the minimum regulatory threshold rather than achieve success. And states also delay listing water bodies as impaired and slow-walk remediation plans.
The EPA should reject any state water quality standards that do not include numeric water quality criteria for major categories of nonpoint source pollution and polluted urban runoff, such as nitrogen, phosphorus, and sediment, among others. The numeric criteria should ratchet down over time. For watersheds that cross state lines, the EPA should work with states to determine the relative share of NPS and polluted urban runoff that each state contributes to the water body during a three-year baseline period and then require each state to make proportional reductions. States that fail to make adequate progress would risk losing federal environmental funds and primacy for enforcement of the CWA.
This report uses the Great Lakes region and the Maumee River watershed in Northwest Ohio to demonstrate how insufficient federal funding and the EPA’s failure to fully leverage existing CWA legal authority allows harmful NPS pollutants and polluted urban runoff to continue threatening public health, economic growth, and environmental sustainability. The Great Lakes region and the Maumee River watershed are powerful case studies because they demonstrate the scale of the pollution challenge, the power of the EPA to catalyze water quality improvements by leveraging existing authority of the CWA, and the need for more federal financial assistance to make substantial water quality progress in the coming years.
With higher levels of public investment and a more aggressive approach to improving water quality, the federal government—working in combination with state and local governments, land owners, and community stakeholders—can improve public health, promote environmental sustainability, and support robust and inclusive economic growth.
Evolution of clean water policy and federal funding
The Clean Water Act amendments of 1972 established the structure of modern federal water pollution control policy. The goal of the CWA was to restore and maintain “the chemical, physical, and biological integrity of the Nation’s waters.”19 The act created grant programs to support the construction and modernization of municipal sewage treatment works as well as a regulatory regime to control the discharge of harmful pollutants from both public and commercial pipes, known as point sources. Research shows that the CWA has significantly reduced water pollution from point sources, leading to measurable improvements in water quality.20
However, the 1972 act had one major deficiency: It did not meaningfully regulate nonpoint sources of water pollution, which include everything from fertilizers, herbicides, and pesticides from agricultural production to oil and toxic chemicals from direct drainage of urban stormwater runoff. Additional NPS pollutants include sediment from construction sites and salt from irrigation and snow removal, as well as drainage from abandoned mines and bacteria from livestock waste and broken septic systems.21
Regulated vs. unregulated water
Under the Clean Water Act, most nonpoint water flows are not subject to regulation. For instance, the water that drains off a farmer’s field and eventually makes its way into local lakes and rivers is not regulated. Similarly, stormwater in urban areas that flows overland and directly into local waters without passing through a municipal separate storm sewer system is also unregulated. By comparison, urban stormwater that is collected, transported, and discharged by an MS4 is regulated by the CWA. The local agency responsible for the MS4—often the local department of environmental services—must obtain a National Pollutant Discharge Elimination System (NPDES) permit. The NPDES permit requires the holder to implement certain modest pollution control measures, including but not limited to educating the public, monitoring pollution, and preventing the illegal dumping of pollutants into the storm drain system. Rural nonpoint flows, direct drainage, and MS4 discharges all share a common feature: These flows enter receiving waters without being treated.
Section 208 of the 1972 act required governors to identify those water bodies with substantial “water quality control problems” and to create areawide waste treatment management plans.22 And while the section mentions two broad categories of nonpoint pollution —“agriculturally and silviculturally related nonpoint sources of pollution” and “mine-related sources of pollution”—the Section 208 grant program was focused on the construction of “treatment works necessary to meet the anticipated municipal and industrial waste treatment needs” in “urban-industrial concentrations.”23
In 1987, Congress passed amendments to the CWA, establishing a dedicated grant program known as Section 319 to help states implement nonpoint pollution control projects. Yet it’s important to understand that Congress chose to approach nonpoint pollution in a fundamentally different manner than it approached point sources. For instance, under federal law, it is illegal to discharge a pollutant from a point source without first receiving a permit through the NPDES.24 An NPDES permit sets quantifiable limits on pollutant discharge. NPDES permit limits depend on the type of discharge as well as the quality of the receiving waters. For instance, local stormwater agencies are required to reduce pollutant discharges from MS4s to the “maximum extent practicable.”25 Certain industrial dischargers are held to a standard known as “Best Practicable Control Technology Currently Available.”26
By comparison, the EPA does not directly regulate nonpoint discharges. Instead, the 1987 amendments created a weak incentive-based program. States must identify water bodies that will not achieve water quality standards without controlling pollution from nonpoint sources and then submit to the EPA a plan for controlling nonpoint pollution based on “best management practices.”27 Section 319 of the 1987 amendments created a grant program that provides funding to states to implement NPS control projects. In fiscal year 2019, Congress appropriated a meager $165.4 million for Section 319 grants.28 In 2013, the EPA stated in its own program guide that “NPS control funding needs far exceed the resources appropriated under § 319.”29 In the seven years since the EPA noted the funding shortfall, Congress has increased the appropriation by only $9.5 million, which is not enough to keep pace with inflation over this same period.30
The 1987 amendments included a second major policy shift: Congress switched federal support for the construction and maintenance of municipal wastewater treatment works from grantmaking to low-cost financing. The act required every state to establish a Clean Water State Revolving Fund (CWSRF).31 Each year, Congress appropriates funding to recapitalize the CWSRFs so that states may make another round of low-cost loans to local project sponsors. In FY 2020, Congress appropriated $1.64 billion in capitalization grants to state revolving loan funds.32
The switch to low-cost financing is important for two reasons. First, offering project sponsors access to low-cost financing is a reduced form of subsidy compared with a grant. Wastewater authorities and stormwater agencies typically operate as enterprise funds reliant on monthly user charges.33 For communities facing sustained economic hardship, the ability to raise billing rates to repay CWSRF loans—even with the interest rate subsidy offered with these loans—is limited. And in more economically stable communities, the political economy aligns against raising billing rates, which puts downward pressure on implementing aggressive pollution reduction plans.
Second, states have considerable discretion when developing their project selection and prioritization criteria for distributing CWSRF financing. States may choose to provide a deeper credit subsidy for certain geographic regions or for traditional gray infrastructure facilities—including collection pipes and concrete conveyances as well as energy-intensive treatment works—as opposed to more environmentally sustainable “green” or natural infrastructure approaches to water management.34 For instance, the state of Ohio’s CWSRF prioritization framework offers a much deeper credit subsidy for traditional gray combined sewer overflow (CSO) reduction projects than green infrastructure alternatives. Beginning in 2017, Ohio set aside $300 million for CSO reduction projects at 0 percent interest.35 Yet clean water projects that include a substantial green infrastructure component are eligible for an interest rate discount of 25 basis points (or 0.25 percent) off the standard loan rate, which is equivalent to a general obligation bond with a AA rating as tracked by the Municipal Market Data Index.36 Given that implementing, monitoring, and maintaining green infrastructure projects comes with novel challenges for local authorities that have historically built traditional gray facilities, the modest rate inducement offered by Ohio may fail to catalyze a substantial green buildout.
In addition to Section 319 and the CWSRF capitalization grants, other federal programs provide funding that helps address nonpoint source water pollution. These include the CWA’s Geographic Programs, which are funded via an EPA appropriations subaccount of Environmental Programs and Management. Geographic Programs provides funding for targeted water quality restoration commitments for regionally and nationally significant water bodies with persistent impairment. Some examples of water bodies that receive funding through the Geographic Programs subaccount include the Great Lakes, the Chesapeake Bay, Puget Sound, and water bodies in South Florida, among others.37 Geographic Programs spending supports a range of projects and activities tailored to address the unique circumstances and challenges of each authorized water body.
Additionally, there is the U.S. Department of Agriculture’s Environmental Quality Incentives Program (EQIP). EQIP supports a broad range of environmentally sustainable practices, including everything from crop residue management and promotion of at-risk species habitat conservation to water conservation and control of NPS pollution.38 And third is the Regional Conservation Partnership Program (RCPP), also at the Department of Agriculture. The RCPP provides funding for an array of projects that promote water quality, critical habitats, and soil conservation, among other goals.39
Taken together, Section 319, CWSRF capitalization, Geographic Programs, EQIP, and the RCPP, among other federal programs, provide important but insufficient funding for state and local authorities to achieve the goals of the Clean Water Act. Additionally, substantial state discretion in the prioritization of flexible financing may create disincentives for local wastewater authorities to implement green infrastructure projects that deliver substantial water quality improvements. Finally, the EPA’s weak incentive-based approach and failure to fully leverage the legal authority of the CWA has allowed NPS water pollution to continue over time.
The Maumee River watershed and the Great Lakes region
The Maumee River watershed in Northwest Ohio serves as a powerful example of the lack of urgency, financial challenges, and achingly slow progress that plague clean water policy, particularly efforts to reduce water quality impacts from agricultural nutrient pollution.
The Maumee River is a major tributary of Lake Erie as well as an important waterway providing navigation access to the Port of Toledo and other commercial facilities along the waterfront. The Maumee River watershed drains approximately 5,024 square miles of land over all or part of 18 Ohio counties and extends to Indiana and Michigan as well.40 The watershed was designated as an area of concern (AOC) in 1987 in accordance with the Great Lakes Water Quality Agreement.41
Great Lakes Water Quality Agreement
The Great Lakes Water Quality Agreement is a binational framework between the United States and Canada originally signed in 1972 and amended over years, including most recently in 2012.42 The agreement is intended to facilitate cooperation on clean water policy. One of the stated goals of the agreement is for the Great Lakes to “be free from nutrients that directly or indirectly enter the water as a result of human activity, in amounts that promote growth of algae and cyanobacteria that interfere with aquatic ecosystem health, or human use of the ecosystem.”43 Nutrient pollution remains a critical problem with no end in sight.
The Maumee River and Lake Erie have significant pollution challenges, including high nutrient and sediment levels as well as large hypoxic zones. According to the Ohio Environmental Protection Agency (Ohio EPA), the Maumee River is listed as impaired for drinking water, aquatic life, fish and shellfish consumption, and recreation.44 The river contains high levels of salts, polychlorinated biphenyls (PCBs), nitrogen and phosphorous, sediment, algae, and bacteria.45 These pollutants come from a combination of sources, including active and abandoned industrial sites, municipal sewage discharges, farms and animal feed lots, broken septic systems, and storm runoff carrying salts used to de-ice roads, among other sources.
Nutrient and sediment pollution are especially challenging. According to research by the Ohio EPA, the Maumee River watershed releases more than 2,200 metric tons of phosphorous into Lake Erie each year.46 A 2019 assessment of Lake Erie found that the lake received 11,362 metric tons of phosphorus in that year.47
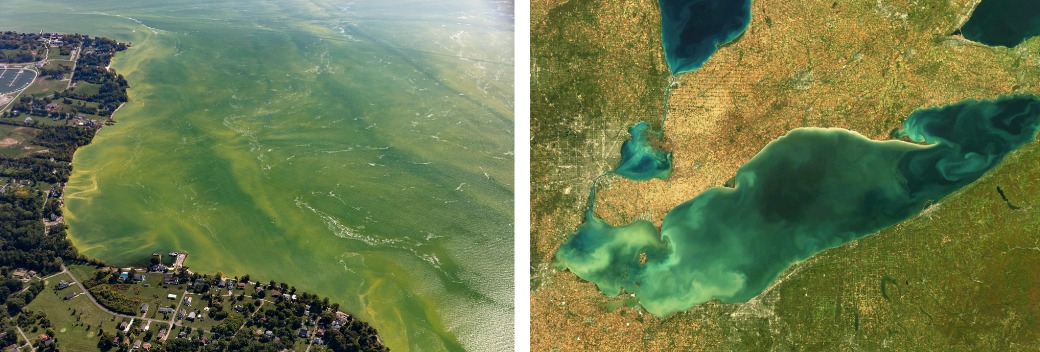
Heavy nutrient loading has resulted in dangerous algal blooms in the Western Basin of Lake Erie. Approximately 500,000 residents of the city of Toledo and other communities in Northwest Ohio obtain their drinking water from an intake pipe located a few miles offshore in Lake Erie.48 In 2014, Lake Erie experienced a massive cyanobacteria algae bloom.49 Around 1:20 a.m. on August 2, the city of Toledo posted on its Facebook page an urgent message telling residents not to consume or even come in contact with city water until further notice.50 City water chemists had detected harmful levels of a dangerous toxin produced by the algae called microcystin, which can result in “abnormal liver function, diarrhea, vomiting, nausea, numbness or dizziness.”51
The situation was so dire that then-Gov. John Kasich (R) declared a state of emergency and activated the Ohio National Guard to help with logistics, including bringing in huge containers of clean drinking water to allow residents to fill jugs to take care of essential needs.52 Toledo lifted the warning three days later.53 Though the shutdown was relatively brief, the toxic bloom cost the regional economy an estimated $65 million.54
Cyanobacteria fed by nutrient pollution are not a new water quality problem. In fact, reducing nutrient loading was one of the goals of the 1972 Great Lakes Water Quality Agreement between the United States and Canada.55 Northwest Ohio has experienced increasingly severe cyanobacteria blooms since 1995.56 Agricultural runoff is a major source of pollution because commercial fertilizers contain two components that serve as nutrients for algae and other aquatic plants: nitrogen and phosphorus.57 According to the U.S. EPA, phosphorous “plays major roles in the formation of DNA, cellular energy, and cell membranes (and plant cell walls).”58 Additionally, according to the U.S. Geological Survey, “Excess nitrogen can cause overstimulation of growth of aquatic plants and algae. Excessive growth of these organisms, in turn, can clog water intakes, use up dissolved oxygen as they decompose, and block light to deeper waters.”59 Stated simply: Phosphorus and nitrogen are plant food. Although these elements are helpful for crop production, they become a serious pollution challenge when they flow into rivers and lakes.
Figure 1
Not surprisingly, Lake Erie continues to experience harmful algal blooms, including a massive bloom in 2017 that covered more than 700 square miles of the western portion of the lake.60 Algal blooms are such a common problem that the National Oceanic and Atmospheric Administration (NOAA) established a harmful algal bloom forecasting unit that provides ongoing estimates.61
Without aggressive action by the state of Ohio in partnership with the federal government, local governments, landowners, the agricultural sector, and other community stakeholders, this problem will persist, damaging critical ecosystems, public health, and the region’s economy. Unfortunately, the state of Ohio has still not set water quality standards for the Maumee River that include a total maximum daily load for nitrogen and phosphorous.62 And even after multiple massive algae blooms, including one that triggered a water shutdown for a major city, Ohio still has not finalized a Maumee River restoration plan.63
The Maumee River example demonstrates how the rational policy structure created by the Clean Water Act, which includes testing to identify impaired waters, goal setting, planning, project and program implementation, and progress reporting, contains weaknesses that allow pollution to remain year after year. The real challenge facing the CWA is a lack of sufficient political will—both to leverage existing legal authority to push for progress as well as to address in a timely manner a complex, challenging problem that spans political jurisdictions and doesn’t lend itself to ribbon cuttings and silver-bullet technological solutions.
Total maximum daily loads
Under federal law, states must set water quality standards that conform to the goals of the Clean Water Act.64 The U.S. Environmental Protection Agency is required to review and either approve or disapprove state standards. If a state has failed to develop adequate standards, the CWA requires the EPA to step in and set appropriate standards for that state. In practice, the EPA rarely rejects state standards.
As part of the standard-setting process, states must adopt water quality criteria. These criteria range from a qualitative description to a quantifiable limit for a particular pollutant. For instance, Ohio has adopted numerous qualitative water quality criteria. For instance, all surface waters of the state should be “[f]ree from materials entering the waters as a result of human activity producing color, odor or other conditions in such a degree as to create a nuisance.”65 Additionally, all waters should be “[f]ree from nutrients entering the waters as a result of human activity in concentrations that create nuisance growths of aquatic weeds and algae.”66 For waters with nuisance growths of aquatic weeds and algae, Ohio has adopted a quantitative discharge criteria for point sources. The criteria requires that phosphorus discharges from point sources “shall not exceed a daily average of one milligram per liter of total [phosphorus].”67
Ohio’s water quality standards stretch to more than 540 pages.68 These examples are only a small sampling of the state’s overall goals for water quality. Yet these examples highlight a shortcoming of CWA implementation. On the one hand, Ohio has a quantitative discharge limit for phosphorus from point sources in areas with nuisance weeds and algae, including the Maumee River watershed and Lake Erie. With this criterion in place, the Ohio EPA can test commercial and municipal point source discharges to determine if they are in compliance. The quantitative criterion provides clarity for regulators and regulated dischargers alike.
On the other hand, the quantitative discharge criterion applies only to point sources, which are only a fraction of the nutrient pollution that produces harmful algal blooms like the one that hit the Western Basin of Lake Erie in 2014. According to the U.S. EPA, Ohio has not adopted a statewide quantitative criterion for total nitrogen or total phosphorus pollution.69 Instead, state and local officials are left with water quality standards based on a subjective threshold that weeds and growth should not reach “nuisance” levels. Yet nuisance is not defined, and it’s unclear how this narrative standard should inform NPDES permit writers, water pollution control program design, and water quality infrastructure project selection.
Enter the total maximum daily load (TMDL), which states must develop when water bodies do not meet water quality standards. (Such waters are often called “impaired.”) A TMDL sets the maximum amount of a pollutant allowed to enter a water body on a daily basis. The TMDL accounts for pollutant loading from point sources, nonpoint sources, and any naturally occurring or background amounts as well as a margin of safety.70 The TMDL level is set so that the impaired water body can achieve its water quality standard over time. Under Section 303 of the CWA, “Each state shall establish” a TMDL for impaired water bodies.71 Additionally, the TMDL “shall be established at a level necessary to implement the applicable water quality standards.”72
The CWA requires states to establish a priority ranking list for the development of TMDLs for impaired waters.73 The role of the Maumee River in fueling pollutant loading in the Western Basin of Lake Erie is so acute that a report by the International Joint Commission, which is a binational body established by the United States and Canada to advise on transboundary water issues, including those affecting the Great Lakes, stated that “current knowledge is sufficient to justify immediate additional efforts to reduce external loading of nutrients to Lake Erie.” Moreover, the report states, “The highest priority for remedial action should be the Maumee River watershed.”74 Yet to date, the Ohio EPA has not completed a TMDL for the Maumee River watershed.
Figure 2
In early February 2020, Ohio Gov. Mike DeWine (R) announced the state’s intention to set a TMDL for the Western Basin of Lake Erie.75 The process is likely to take at least three years. Even assuming the state finalizes a TMDL plan that receives U.S. EPA approval within this time, nearly a decade will have passed since the toxic algal bloom in the Western Basin forced a shutoff of Toledo’s drinking water system for three days. And even then, the plan would only begin its implementation cycle.
Regrettably, Ohio is not alone in failing to develop and implement TMDLs for impaired waters on a timely basis. According to data compiled by the Congressional Research Service, more than 1,500 water bodies or portions of water bodies across 30 states are listed as impaired due to recurrent harmful or toxic algal blooms.76 Yet states have adopted a TMDL for only 30 percent of those impaired bodies.77
Another weakness in the CWA is the impairment determination that gives rise to TMDL development. Successive governors in Ohio have resisted listing the Western Basin of Lake Erie as impaired.78 In fact, the Ohio EPA delayed listing the Western Basin as impaired until 2018 even though the lake has suffered the effects of harmful agal blooms and hypoxia for many years.79 This decision came only after the U.S. EPA withdrew its approval of Ohio’s formal list of impaired waters—known as the Section 303(d) list in reference to the CWA.80 Ohio’s reluctance to list Lake Erie as impaired stems, in part, from a mixture of politics and the CWA requirement that impaired waters must receive a TMDL.
For instance, following Gov. DeWine’s announcement regarding the state’s intention to develop a TMDL for the Western Basin, the Ohio Corn and Wheat Growers Association (OCWGA) and the Ohio Soybean Association (OSA) came out against the effort: “OCWGA and OSA do not believe a TMDL is the best way to advance the goals that have been set for Lake Erie.”81 This opposition is significant given the size and importance of farming to Ohio’s economy. According to data from the U.S. Department of Agriculture, Ohio farmers plant 4.3 million acres of soybeans, 2.8 million acres of corn, and a half-million acres of wheat each year, with a total economic value of $3.8 billion.82 As challenging as the politics may be, the scientific evidence is clear. According to the Ohio EPA, “nonpoint source nutrients are found to be the major contributor of downstream total phosphorus load” in the Maumee River, and “only focusing remediation on point source nutrients would neither be prudent or efficient to protect downstream waters.”83
Ohio’s reluctance to list Lake Erie as impaired, combined with decades of insufficient effort to stem the flow of NPS pollution and polluted urban runoff into the Maumee River and other tributaries, demonstrates that the U.S. EPA must use its existing authority to disapprove state water quality standards and implementation plans that fail to make aggressive water quality improvements. Furthermore, Congress must increase funding to state and local governments.
Climate change and pollution
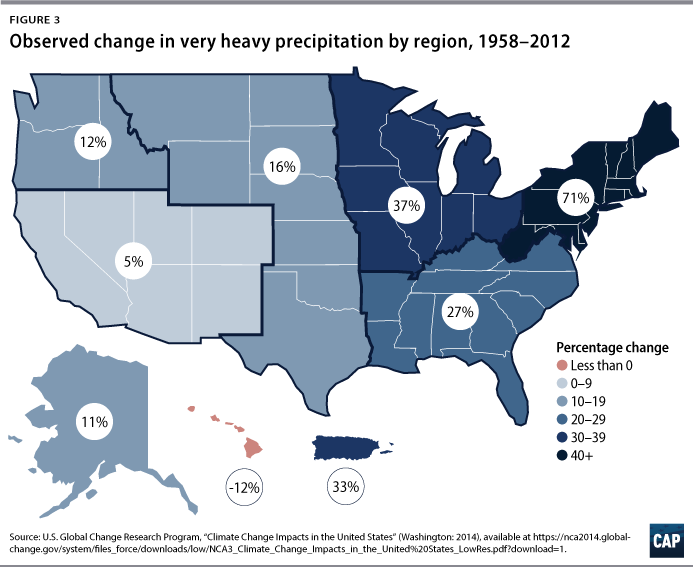
The need to systematically and aggressively address nonpoint source pollution and polluted urban runoff is only made more urgent by climate change. In general, a warmer atmosphere holds more moisture, leading to more frequent and intense rainstorms. This is especially true of the Great Lakes region. Historical meteorological data indicate that over the past century, total rainfall in the United States has increased by roughly 4 percent. In the Great Lakes region, rainfall has increased by 10 percent, or roughly 250 percent more when compared with the nation as a whole.84
This trend is problematic for water pollution control because intense rains lead to more NPS pollution and polluted urban runoff. Moreover, many urban areas still have combined sewer systems that transport both stormwater and wastewater from homes and businesses to a treatment plant. When more powerful storms drop a large volume of precipitation in a short period of time, combined systems discharge untreated stormwater and wastewater into local waterways. This is known as combined sewer overflow. For instance, one study estimated that more intense storms would lead to a 50 percent to 120 percent increase in CSO discharges in southern Wisconsin in the coming decades.85
Heavier and more frequent rainstorms present a risk to the Western Basin of Lake Erie. The city of Toledo has a combined sewer system that handles both stormwater and wastewater flows. In 2019, untreated discharges occurred at outfalls around the city a total of 158 times.86 The International Joint Commission found that the increased frequency and intensity of storms has raised bioavailable phosphorus loads to “the highest level observed in the 35‐year monitoring record for the Maumee and Sandusky rivers.”87 In 2016, the United States and Canada agreed to develop domestic pollution control plans, with the goal of reducing phosphorus pollution in Lake Erie by 40 percent compared with a 2008 baseline.88 Separately, Michigan, Ohio, and the Canadian province of Ontario set an aspirational timetable to reduce phosphorus loading in the Western Basin by 2025, with a goal to reduce loading by 20 percent by 2020.89 However, research shows that there has been no decrease in phosphorus flowing into Lake Erie. A recent report by the Ohio Environmental Protection Agency found that recent efforts had resulted in “no clear decrease in loading yet.”90
Lake Erie is only one example, as climate change will create water pollution challenges everywhere. Without increased federal funding and more aggressive enforcement of Clean Water Act mandates, global warming will cause further ecosystem degradation across the country.
Green infrastructure
Polluted urban runoff—both direct drainage and municipal separate storm sewer system discharges91—is a substantial water pollution challenge. Both direct drainage and MS4 discharges flow into local receiving waters without being treated. The most common categories of urban runoff pollution include “solids, oxygen-demanding substances, nitrogen and phosphorus, pathogens, petroleum hydrocarbons, metals, [and] synthetic organics.”92
Additionally, urban areas have many impervious surfaces, including roadways, parking lots, and buildings, which reduce the amount of land available to absorb precipitation. Hard surfaces increase both the volume and speed of stormwater flows into local waters. In fact, stormwater runoff in dense urban areas is roughly five times greater than ground with natural vegetative cover.93 Rapid storm flows not only carry pollutants but also lead to “increased shoreline erosion, stream channel widening, and increased stream bed scouring.”94 The combination of pollution and physical alterations to watercourses and habitats harms aquatic species and often leads to serious water impairment.
Green infrastructure95 “refers to stormwater management techniques that mimic natural hydrologic functions and incorporate the natural environment to treat stormwater where it falls.”96 The goal of green infrastructure is “to store, infiltrate, or evapotranspirate stormwater and reduce flows to sewer systems or to surface waters.”97 In short, green infrastructure projects help manage precipitation close to where it falls and are a proven method of reducing flooding, untreated combined sewer system discharges, and polluted runoff.
A recent research study funded by the National Oceanic and Atmospheric Administration looked at the cost effectiveness of green infrastructure improvements in the Maumee River watershed and Duluth, Minnesota. The NOAA report found that green infrastructure projects are cost effective for reducing flooding and improving water quality when costs and benefits are calculated over more than a 20-year period.98 The report principally looked at avoided flood damage to structures but highlights that green infrastructure provides important economic and ecological co-benefits, including “improved water quality, increased habitat, improved aesthetics, and higher property values.”99
One example of green infrastructure is bioretention. A bioretention project consists of creating a shallow depression in the ground that may have a reconstructed subsurface layer that allows for faster stormwater infiltration as well as water-tolerant vegetation planted on top. This type of project may be located next to a roadway, parking lot, or other hard surface that would normally serve as a conduit for stormwater to flow into a storm drain or local waters. Another type of project is a detention wetland, which is a type of constructed wetland designed to significantly slow the flow of storm runoff into local lakes and rivers. Additionally, the wetlands provide natural filtration and absorption of nutrients and other pollutants, leading to water quality improvements. These types of projects can produce significant water quality improvements.
For instance, in 2011, the U.S. Environmental Protection Agency awarded the University of Toledo a $1.35 million grant100 as part of the Great Lakes Restoration Initiative to construct a sediment pond and treatment wetland to reduce the amount of suspended solids, E. coli, and total phosphorus flowing from Wolf Creek into the Western Basin of Lake Erie.101 Additionally, the project intended to reduce the number of swim advisories limiting recreation at the nearby Maumee Bay State Park. The project has produced impressive results. Data collected by the university show a 94 percent reduction in E. coli bacteria, as well as a 50 percent reduction in total phosphorus entering Lake Erie.102
NOAA’s finding that green infrastructure projects are cost beneficial comes with a catch: Only a small fraction of the benefits from green infrastructure are monetized by the implementing agency. The monthly wastewater and stormwater bills paid by homeowners and local businesses don’t include a line item for avoided flood damage and ecological co-benefits. The only financial benefit for a local wastewater authority operating a combined sewer system that collects both stormwater and sewage is the reduced volume of stormwater that must be treated before being discharged. However, the payback from this avoided treatment cost is likely insufficient for a wastewater agency to implement an aggressive program of green infrastructure projects.
Green infrastructure projects clearly help reduce stormwater and other pollution flows, improving water quality. Yet their implementation adds some complexity to operations and management for local water agencies. First, green infrastructure projects are highly distributed. Implementing a robust program of green infrastructure may mean constructing hundreds of features across a metropolitan area. While no one green infrastructure element adds much complexity, an entire system of projects means developing effective programs to monitor and maintain these natural facilities to ensure they are delivering their maximum stormwater management benefits. Second, some water agencies may shy away from implementing green infrastructure projects due to bureaucratic conservatism. Local water authorities have a long history of building and managing traditional gray infrastructure. As a result, they may assume that gray assets are more durable or technologically dependable.
This fact has important implications for clean water policy. The federal government must expand its financial assistance—both grants and financing—to municipal stormwater and wastewater agencies to achieve the goals of the Clean Water Act, including a strong focus on green infrastructure to reduce polluted urban runoff and combined sewer system overflows. Moreover, the federal government needs to provide robust technical assistance to agencies starting down the path of green infrastructure deployment, including research design, data collection, and analysis to continue building the analytical case for natural approaches to stormwater management.
Using the CWA and funding to the fullest
Setting a total maximum daily load for the Maumee River or even an aggressive binational target such as the 40 percent phosphorus reduction for Lake Erie would only be meaningful if there were adequate funding and political will to drive implementation over time. At present, there is neither sufficient funding nor the political will to achieve the goals of the Clean Water Act. A 2008 report produced jointly by state water associations and staff from the U.S. Environmental Protection Agency shows the perils of continuing with a business-as-usual approach:
Continuing the status quo, on the other hand, will ensure increasingly degraded ecosystems, lost aquatic habitat and species diversity, abandonment of water quality standards in vulnerable watersheds, increased drinking water risks, and the greater future costs associated with lost economic opportunity, vanishing recreational resources, and increased treatment, recovery and restoration.103
These words apply to the U.S. EPA as much as to state and local governments. The CWA provides the agency with substantial legal authority to drive water quality improvements—especially the authority to reject inadequate state water quality standards and pollution control plans as well as impaired waters lists that have clear omissions. As the Lake Erie example in Ohio demonstrates, when the EPA asserts its authority, it can catalyze a long-overdue impairment listing and TMDL plan.
For regional and national water bodies with persistent impairment challenges, including but not limited to phosphorus, nitrogen, and sediment, the U.S. EPA should require states to establish quantitative water quality criteria that ratchet down over time. Each state within the watershed would be responsible for revising its pollution control plan to achieve aggressive quantitative targets, including quickly developing TMDLs. At a minimum, the EPA should require that each state submit an updated plan showing how it would reduce pollutant loading in proportion to state contributions as determined from a three-year baseline period. For states that fail to submit sufficiently aggressive pollution control plans, the EPA should use its authority to write plans and revoke state primacy for CWA implementation.
The 2012 Great Lakes Water Quality Agreement and subsequent U.S. Action Plan for Lake Erie serve as rough templates for how the U.S. EPA should set goals and push states to make progress around the country. The agreement sets a numeric goal of reducing total phosphorus by 40 percent through proportional reduction commitments by the United States and Canada. For instance, to achieve shared water quality goals in the Central Basin of Lake Erie, the United States committed to reducing its annual total phosphorus load by 3,316 tons and Canada committed to a reduction of 212 metric tons.104
Table 3
To date, The United States has not made measurable progress on its phosphorus reduction goal for Lake Erie.105 A central challenge for the GLWQA—and water quality standards generally—is that “[a]doption of agricultural management practices to control phosphorus losses are reliant on voluntary actions by farmers.”106 Because the CWA does not regulate nonpoint source pollution the way it does point sources, any successful plan to meet water quality standards will rely heavily on voluntary actions induced by sizable financial incentives. In this case, the financial incentives should come primarily from Washington with a state match.
- First, Congress must substantially increase funding for the Section 319 grant program from its current level of $165 million to at least $1 billion, with 15 percent of funds set aside for competitive distribution to those states making the most progress toward achieving national water quality standards.
- Second, Congress should increase spending on Geographic Programs from its current level of $510 million to $1 billion annually.107
- Third, Congress should increase spending for the Environmental Quality Incentives Program at the U.S. Department of Agriculture to $7 billion annually, with $200 million set aside for Conservation Innovation Grants. Additionally, EQIP should be amended to require that not less than 35 percent of funds go to projects explicitly designed to reduce nutrient and sediment runoff from agricultural lands.
- Fourth, Congress should double funding for the Regional Conservation Partnership Program from its current level of $300 million annually to $600 million, with at least 35 percent of funds set aside for projects primarily intended to improve water quality.108
- Fifth, Congress should increase funding for Clean Water State Revolving Funds from $1.6 billion to $10 billion annually. States should be required to distribute 20 percent of the capitalization as grants to wastewater authorities in disadvantaged communities facing the greatest need. Additionally, 20 percent of the capitalization should be set aside for green infrastructure projects.
These amounts may seem like a lot, but it’s essential to remember the economic value of clean water. For instance, in FY 2020, the Great Lakes Restoration Initiative (GLRI) provided $320 million, which is a modest sum compared with the economic value of the Great Lakes and the economies connected to them.109 A report by the U.S. EPA states that the economic value of recreation, tourism, and fishing tied to Lake Erie alone is $12 billion annually, or 37 times more than the GLRI expenditure.110 Moreover, the collective annual economic output of the Great Lakes states is just shy of $6 trillion annually.111
In addition to carrots, Congress must also be willing to bring a few sticks, including either reducing a state’s share of Geographic Programs, EQIP, RCPP, and CWSRF grant funds or raising the state’s matching requirement. For instance, if a state within the Great Lakes region fails to meet its pollution control targets, the EPA should reduce its share of GLRI grant funds under the Geographic Programs subaccount. Under federal law, Section 319 grant funds “shall not exceed 60 percent” of the total cost of a state’s nonpoint source management program.112 For states that fail to make adequate progress, the state match should be raised to 50 percent. And five years after implementation of the cost-share penalty, if the state has still not made adequate progress on water quality goals, the state share should be raised to 60 percent. Similarly, CWSRFs require states to provide a 20 percent match.113 Again, for states that fail to make adequate progress, the match should be raised to 25 percent. If after five years water quality has still not improved sufficiently, the state match should be raised to 35 percent.
Taken together, these investments, combined with more aggressively leveraging existing authority under the CWA, will deliver more rapid and substantial water quality improvements, leading to healthier communities and sustainable economic growth.
Conclusion
It’s easy to take water for granted. After all, lakes and rivers are ancient bodies that change imperceptibly over eons. For many people, water is something that’s just there. Typically, public and political attention around water pollution spikes in response to acute events, such as harmful algal blooms that threaten drinking water supplies and jobs tied to tourism and fishing. When the public health or economic threat subsides, the political will to sustain pollution control measures that would lead to meaningful water quality improvements tends to wane.
This is where pressure from Washington comes into play. The Clean Water Act—and Congress’ power of the purse—provide the U.S. Environmental Protection Agency with substantial authority to hold states accountable for achieving real water quality improvements over time. Through a combination of carrots and sticks, the federal government can provide a sustained focus on reducing water pollution that transcends the typical boom-and-bust public and political attention cycles.
Clean water is essential to the United States’ economy, public health, and environmental sustainability. Yet it won’t happen on its own. Water requires stewardship. The twin forces of population growth and global climate change will further degrade precious water resources unless the federal government takes a more aggressive leadership role, leveraging its fiscal resources and legal authority to elevate the issue week after week, month after month, and year after year.
About the author
Kevin DeGood is the director of Infrastructure Policy at the Center for American Progress.