Many American families are financially insecure. Job growth remains slow and a growing number of jobs are unstable, which means people are vulnerable to layoffs or a cut in work hours that result in lost wages.1 Alongside increasing anxiety about their jobs, people also have to worry more and more about being ill-prepared for an unexpected negative occurrence. Families who are more likely to see possible declines in their incomes are also the ones who have substantially less wealth to cover an emergency, let alone entertain the thought of getting ahead.2 People without a college degree and communities of color especially struggle with the dual challenge of present-day insecurities, such as losses of income due to layoffs and cuts in hours, and an uncertain future due to little to no savings.
This dual challenge of more volatile jobs and low savings creates a vicious cycle for millions of families. On the one hand, they need more savings to pay their bills, particularly when they have unstable jobs, make low wages, are likely to see their hours cut, or experience a layoff, among other short-term challenges. On the other hand, drops in income make it harder for people to save. Families are often forced to dip into their savings more often to meet unforeseen challenges and thus save less money over time. At the same time, they also need more cash to prepare for emergencies. This means they are likely to have fewer—if any—long-term investments that offer a higher return. What’s more, less employment stability causes workers to jump from job to job, meaning less time with one employer, which then makes it harder for workers to qualify, for instance, for retirement benefits. Finally, a higher chance of a drop in income makes people more anxious about paying their bills in the here and now; as a consequence, longer-term savings for assets, such as a house, or for retirement, end up taking a back seat.3
The bottom line is that families who are more likely to see a drop in income because of the current labor market challenges—especially those without a college degree and communities of color—will also be the ones who end up with less wealth and will have a harder time getting ahead.4 Unfortunately, most of these families cannot move for a new job when the opportunity arises or move to a good school district, nor can they start a business and support their children’s education. Families hence find themselves in a vicious cycle of economic insecurity, whereby present-day economic insecurity translates into fewer future economic opportunities.
This issue brief summarizes the most recent available data on the overlap between income volatility and wealth inequality. In summary, the data show:
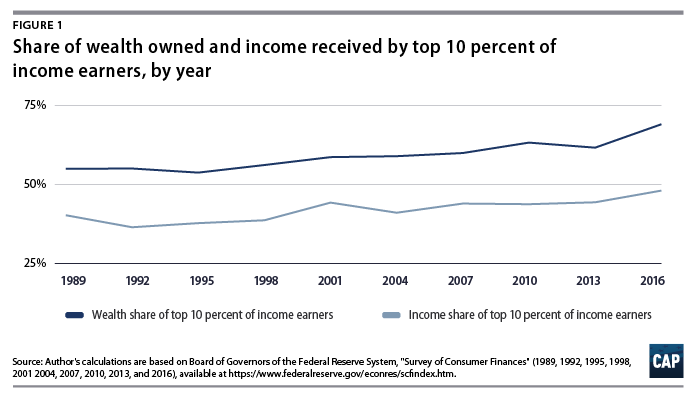
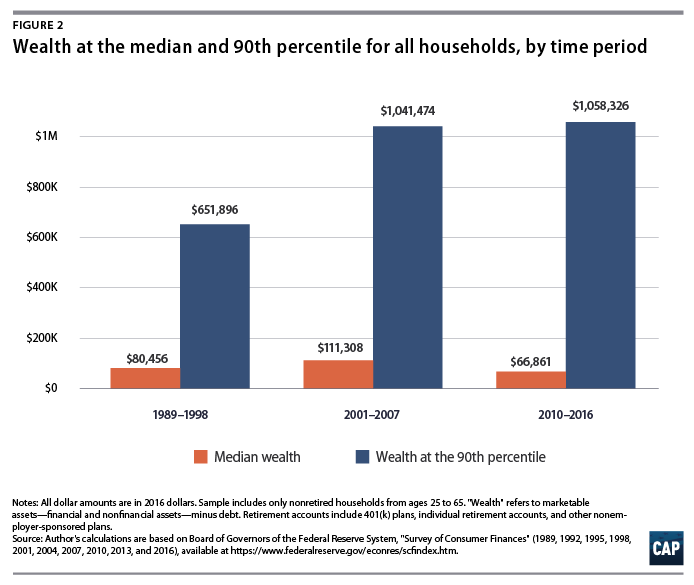
- Wealth has become increasingly concentrated at the top, and middle-class wealth has declined. The top 10 percent of income earners owned more than two-thirds of all wealth in 2016, which is the last year data are available. (see Figure 1) Moreover, in the years after the Great Recession of 2007 to 2009, median family wealth was 40 percent lower than it was in the years before 2007, while wealth at the 90th percentile rose by 2 percent. (see Figure 2 and Table 1)
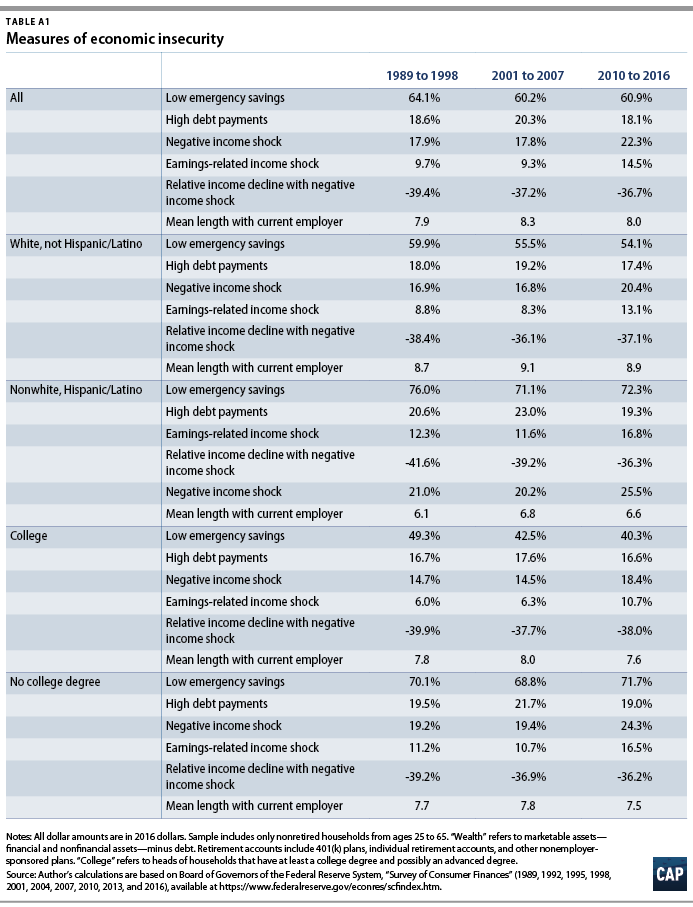
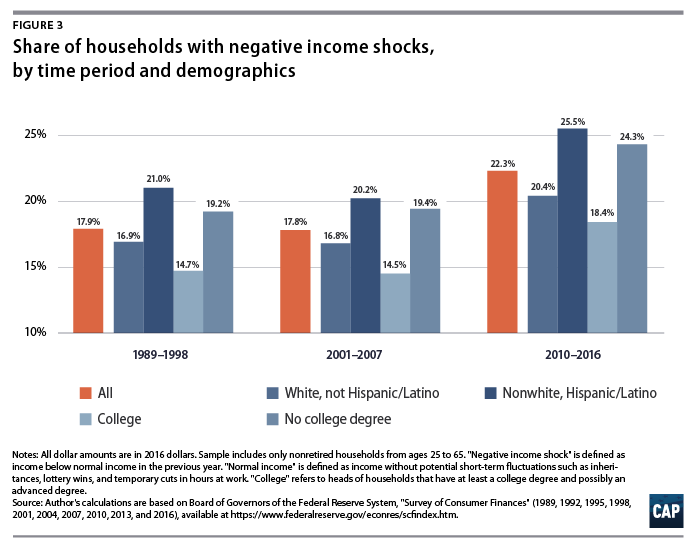
- Income volatility has grown. The share of families who have seen a negative income shock—meaning their income was less than usual in the previous year—grew from less than 18 percent before the Great Recession to 22.3 percent since then.5 (see Figure 3) At the same time, people’s time with their current employer has also fallen since the Great Recession, as workers have lost jobs and moved to new ones, highlighting the fact that jobs have become less stable. (see Table A1)
- The chance of an income drop overlaps with less wealth. Households with negative income shocks had a median wealth of less than $33,016 in 2016 dollars from 2010 to 2016, while households with positive income shocks—meaning their income was greater than usual in the previous year—had $104,300 in median wealth during that same time. (see Figure 5 and Table 3)
- Families who see their incomes fall are more likely to experience economic hardships. For instance, households with negative income shocks were more likely to have been at least two months late on any past payments; to have filed for bankruptcy in the past year; and to be underwater on their mortgage—owing more than their house was worth—during that time. (see Table 2)
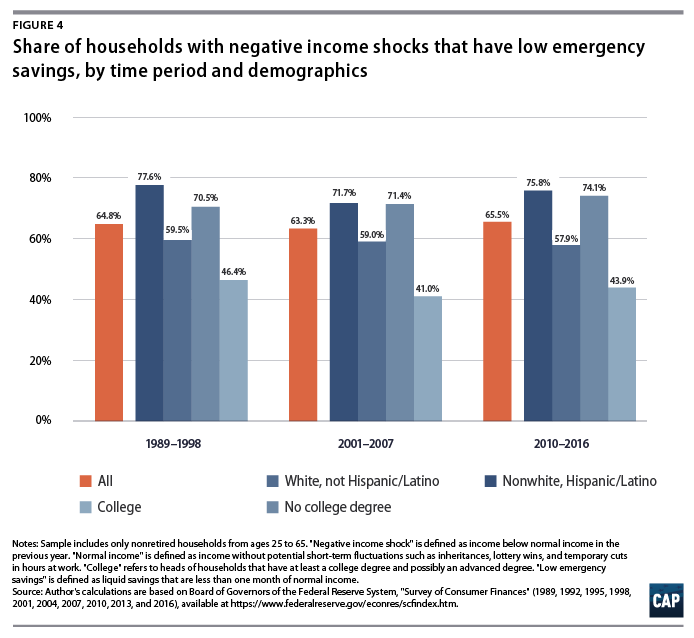
- Income volatility contributes to other financial stresses. About two-thirds of families with negative income shocks did not even have emergency savings equal to one month of their regular income in the years after the Great Recession. (see Figure 4) In fact, roughly one-fourth of families with negative income shocks had debt payments greater than one-third of their income at the same time. (see Table 2)
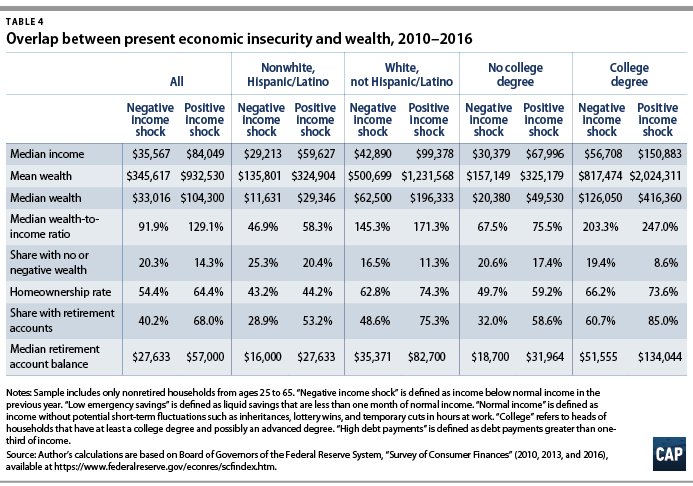
- Economic stress adversely affects families’ ability to save. Typically, households with economic stresses had a less than 40 percent chance of saving regularly or irregularly from 2010 to 2016, while those without economic stresses had more than 50 percent chance of being savers. (see Table 4) Families with more income volatility also are more likely to forego health insurance for economic reasons, a lot less likely to participate in a retirement plan at work, less likely to contribute less to their 401(k) plans, and often have shorter financial-planning horizons (see Table 4).
Working Americans find themselves in a vicious cycle of economic insecurity, especially since the end of the Great Recession in 2009. The possibility of substantial income drops has gone up over the past decade and contributes to massive and widening wealth inequality. Policymakers can break this cycle and help stabilize family incomes by, for instance, guaranteeing that everybody will have a well-paying job. Other policy steps could include more public investments in infrastructure, early childhood education, and caregiving, as well as making it easier for people to join a union and making retirement benefits more widely available.6
Wealth is becoming increasingly concentrated
Wealth serves many important functions for families. It is a means for economic mobility, for instance. Families can use wealth to buy a house in a neighborhood with good schools, to pay for their children’s education, to start a business, to switch jobs when better opportunities arise, and to cover the costs of retirement. Wealth also makes it possible for families to pay their bills in an emergency, such as a layoff or an unexpected medical concern.
Yet, wealth has become increasingly concentrated among the richest families, especially in the years after the Great Recession. In turn, this means that many families in the middle and bottom of the income scale are left with little to no wealth. The lack of substantial wealth puts them in a precarious financial situation today and impedes their economic mobility in the future.
Figure 1 shows the share of wealth owned and income received by the richest 10 percent of U.S. families in each year from 1989 to 2016.7 By 2016, this group of families owned 69.1 percent of all wealth—the highest share since 1989—and received 48.1 percent of all income that year. (see Figure 1)
 The rising wealth concentration came about as the wealthiest Americans quickly recovered from the losses of house and stock prices that occurred during the Great Recession, while those at the median of the income distribution did not. Figure 2 shows wealth at the median—half of all families have more wealth and half have less wealth—and at the 90th percentile of the wealth distribution for three periods: 1989 to 1998, 2001 to 2007, and 2010 to 2016.8 Wealth at the median was about 40 percent lower after the Great Recession than it was in the years prior, while wealth at the 90th percentile was slightly higher. (see Figure 2) The Great Recession clearly hollowed out families’ long-term economic security.
Other measures also highlight the harm to the long-term financial security America’s families sustained after the Great Recession. The share of households with no or negative wealth rose from 9.8 percent in the years before the Great Recession to 14.8 percent in the years since then. (see Table 1) Homeownership dropped from 68.2 percent to 62.9 percent over the same period. (see Table 1) And the share of households with any retirement account dropped from 58.1 percent before the Great Recession—not a large share to begin with—to 55.4 percent in the years since. (see Table 1)
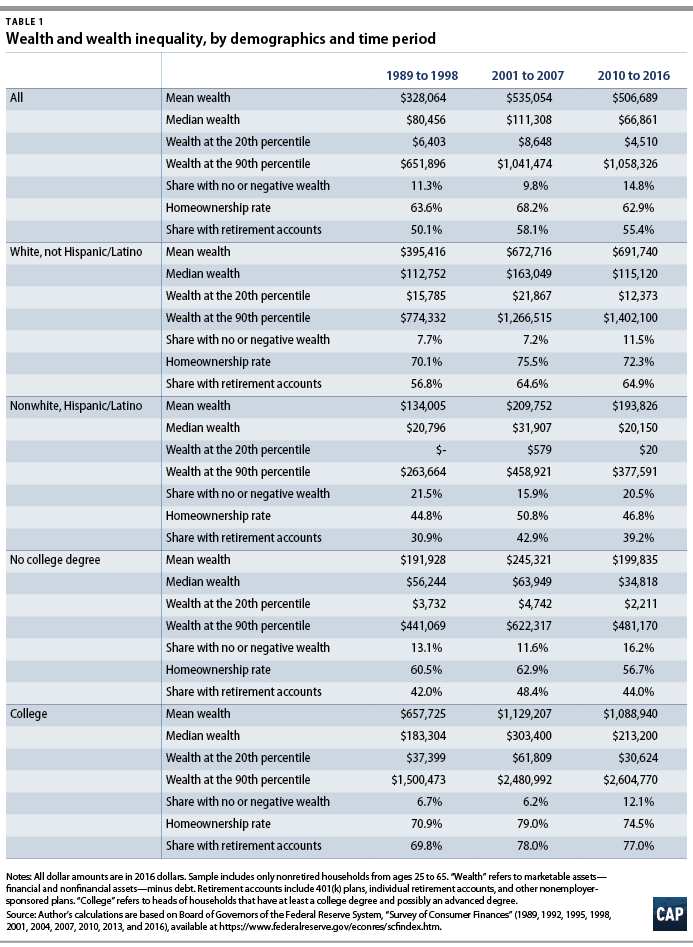
Wealth inequality has grown by education, as well as by race and ethnicity. Wealth inequality was already high before the Great Recession and while most population groups saw their wealth erode after the Great Recession, the losses were greater among those without college degrees and in communities of color. (see Table 1)9 The median wealth of those with at least a college degree was more than six times that of families without a college degree after the Great Recession, whereas it was less than five times prior to the Great Recession. (see Table 1) Similarly, whites had almost six times the median wealth of nonwhite or Hispanic households—$115,120 compared with $20,150. (see Table 1) This is up from five times prior to the Great Recession—$163,049 compared with $31,907. (see Table 1)
Families’ economic uncertainty grew after the Great Recession
The erosion of families’ economic security occurred at a time when families needed more—not less—security. Most importantly, jobs became hard to find, and those who had jobs found that their incomes had become more volatile. The possibility of experiencing a layoff or a cut in hours became more widespread since the Great Recession, which could explain why the chance of a negative income shock has substantially grown over time. In the years before the Great Recession, fewer than 18 percent of families had negative income shocks. (see Figure 3) In the years since then, more than 22 percent of households had negative income shocks. (see Figure 3) The possibility of negative income shocks is greater for nonwhite and Hispanic families than it is for whites, and greater for noncollege-educated families than it is for those with a college degree (see Figure 3).
The growing income volatility has coincided with less employment stability since the Great Recession. (see Table A1) The average length with an employer—a measure of employment stability—went down after the Great Recession and remains low. (see Table A1) Employment stability is already less pronounced among nonwhite and Hispanic families than it is among whites, as well as among individuals without a college degree than those with one. (see Table A1) But since the Great Recession, employment stability has fallen for all groups.
Importantly, the overwhelming majority of income shocks results from earnings-related shocks, such as layoffs, cuts in pay, and lower bonuses.10 By extension, shorter time periods with a current employer likely also reflect such involuntary instabilities, rather than voluntary increases in job mobility.
At the same time, the share of families with low emergency savings—less than one month in liquid assets—has slightly gone up, too. (see Table A1) The data show that this increase has only occurred among nonwhites and Hispanic families—not among whites. Similarly, the share of families without a college degree and low emergency savings has grown, while the respective share among families with a college degree has fallen after the Great Recession. (see Table A1) Emergency savings have become less widespread, especially among the groups of households who have the highest chance of negative income shocks and thus the greatest need for money in an emergency.
In fact, the chance of income shocks and low emergency savings overlap for all families, but especially among communities of color and those without college degrees. (see Figure 4) Almost three-quarters of nonwhite and Hispanic families and families without a college degree who experienced a negative income shock also had emergency savings of less than one month’s worth of income. (Figure 4) In comparison, this was true for less than 60 percent of white families and for less than half of families with a college degree.
Families who are more likely to live with the chance of a negative income shock are also more likely to face economic hardships. For instance, from 2010 to 2016, households with negative income shocks had a 24.7 percent chance of high debt-service burdens—greater than one-third of their income—compared with only a 6.3 percent chance among families with positive income shocks. (see Table 2) Similarly, families with negative income shocks were more likely to have been at least two months late on any past payments; to have filed for bankruptcy in the past year; and to be underwater on their mortgage—owing more than their house was worth—during that time. (see Table 2)
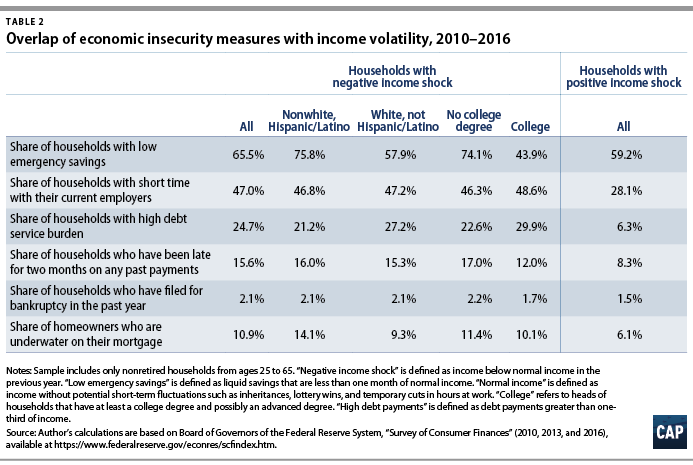
Negative income shocks may further increase the chance of severe financial stress among families of color and those without a college degree. Among families with a negative income shock from 2010 to 2016, the data show that 14. 1 percent of nonwhite and Hispanic families are underwater on a mortgage compared with 9.3 percent of white families who are underwater on a mortgage. (see Table 2) The chance of being underwater on a mortgage after experiencing a negative income shock was also greater among families without a college degree compared with those with a college degree. (see Table 2) The data suggest that negative income shocks correlate with worse economic security among nonwhite and Hispanic families, as well as among those without a college degree than was the case for white families and those with a college degree. That is, negative income shocks make an already bad situation worse for those without a college degree and for communities of color.11
Economic stress contributes to less saving
Families who experience more financial insecurity today also have a lot less wealth for a secure future. This link between short-term and long-term economic insecurity could result from three factors. First, families who experience more income volatility in the present have to dip into their savings more often than do families without it.12 Second, families with more income volatility today may save less because they are less likely to qualify for a retirement plan at work or work for an employer who offers one. This is the case if income volatility coincides with less time working with an employer,13 as workers with shorter tenures often do not qualify for benefits—as opposed to those with more time on the job. Third, people with fewer negative income shocks may be less worried about their present financial situation and more willing to make financial plans for the future. Longer financial planning horizons could then translate into more long-term savings.
The data suggest that negative income shocks are indeed associated with worse outcomes in all three regards. Table 3 summarizes a few indicators related to these possibilities: more limits on spending and thus greater demands on saving; fewer employment benefits; and shorter planning horizons. For example, almost one-third—31.3 percent—of families without health insurance for somebody within the family said they did not purchase health insurance for economic reasons when they experienced a negative income shock. This was true for less than one-fifth—18.5 percent—of families with a positive income shock. (see Table 4) Families with negative income shocks have a harder time affording basic necessities such as health insurance, indicating that income volatility puts more stress on their income and makes it more difficult to save.
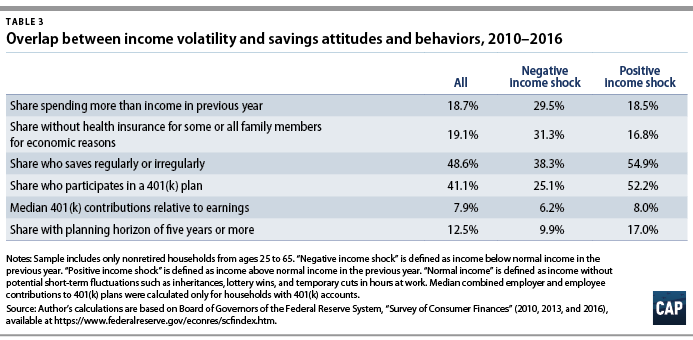
The data also show participation in and contribution to 401(k) plans. Only 25.5 percent of people with a negative income shock participated in a 401(k) plan compared with 52.2 percent with a positive income shock. (see Table 3) This suggests that those with negative income shocks are also less likely to work for an employer who offers retirement benefits.14 And, when people with negative income shocks participated in a 401(k) plan, they contributed less. Their contributions equaled 6.7 percent of their pay from 2010 to 2016, compared with 8 percent of pay for families with positive income shocks. (see Table 3) Those with negative income shocks may be less likely to qualify for employer matches in their 401(k) plan, explaining the lower contributions.
Finally, only 38.3 percent of families with negative income shocks saved, and only 9.9 percent had a planning horizon of five years or longer. (see Table 3) This compares with 54.9 percent of families with positive income shocks who saved and 17 percent who had a long-term planning horizon. (see Table 3)
The gaps by income volatility with respect to spending stresses, benefit participation, and savings behavior are large and likely contribute to wealth differences by drops in income. Put differently, it is likely that income volatility results in lower savings for all three reasons—not just one.
Economic insecurity and low wealth overlap among the most vulnerable families
The data show that different types of short-term economic insecurities overlap among the most vulnerable families. Those with the highest chance of negative income shocks are also very likely to have very low emergency savings. Moreover, these short-term economic insecurities correlate with low wealth. Figure 5 shows median wealth by type of income shock—negative or positive; time with current employer—short or regular; and level of emergency savings—low or higher. Median wealth is a lot higher for families who already have more economic security in their daily lives.
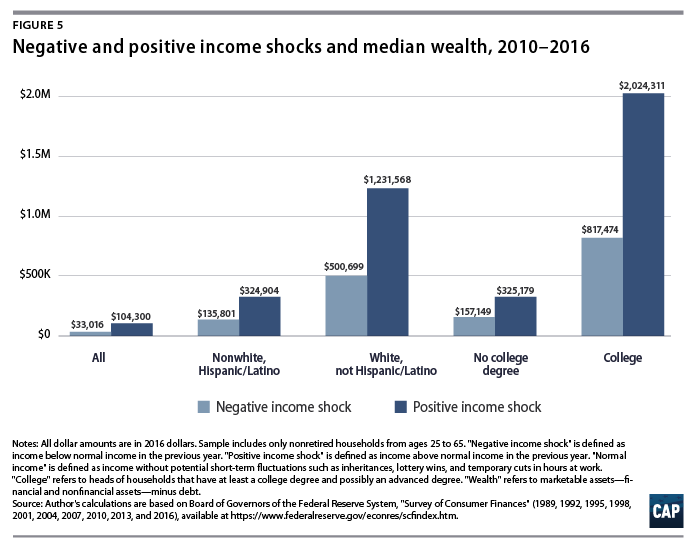
The data so far suggest that income volatility and other economic stress measures, such as short time with the current employer and low emergency savings, may correlate with low wealth. Figure 5 shows total household wealth by income volatility, time with the current employer, and emergency savings. From 2010 to 2016, median wealth is, for instance, a lot less among households with negative income shocks than among those with positive income shocks for the period—$35,567 compared with $84,049. (see Figure 5)
The correlation between drops in income and wealth may be more pronounced among communities of color and those without a college degree than it is among whites and those with at least a four-year college degree. Table 4 shows several measures of wealth broken down by whether the household experienced a negative or positive income shock, in addition to demographics such as race, ethnicity, and education. The median wealth for nonwhites and Hispanic households with a positive income shock was $59,627, compared with $29,213 for those with a negative income shock—or about twice as large. (see Table 4) The ratio of wealth for white households with a positive income shock to wealth for those with a negative income shock was also about twice as large—$99,378 to $42,890. (see Table 4) Moreover, the wealth for families without a college degree with positive income shocks was about 20 percent greater than the wealth of those with a college degree who experienced a negative income shock during that time. (see Table 4) At the same time, those with a college degree and positive income shocks had more than three times the wealth of those with a college degree and a negative income shock. (see Table 4)
Conclusion
American families increasingly find themselves in an economically precarious situation. They experience more negative income shocks, typically from job instability such as layoffs, cuts in hours, and loss of overtime pay. This means they need more wealth to help them pay their bills. But, at the same time, their wealth has not recovered from the massive onslaught of the financial and economic crisis of the Great Recession from 2007 to 2009, and many families are left with little to no wealth. People without college degrees and communities of color are more likely to get caught in the vicious cycle of more volatile incomes, less stable jobs, and less wealth.
Policymakers can break this cycle by stabilizing family incomes and employment. A wide range of policy options exist to accomplish this. These include new jobs in infrastructure, child care, and elder care. Policymakers also need to ensure that newly created will be around long enough by, for instance, implementing a jobs guarantee that employers will pay well enough for people to support their families; making it easier for employees to join a union; and ensuring employees have sufficient retirement benefits.15
Christian Weller is a senior fellow at the Center for American Progress.
Appendix
The data in this brief come from the Federal Reserve’s triennial Survey of Consumer Finances (SCF), a nationally representative survey of U.S. household wealth. The SCF includes comprehensive information on household finances, including income and income volatility, as well as household wealth, including all assets, debt, and debt payments. It also contains information on savings attitudes and behaviors. The SCF further includes data on household characteristics, such as the race and education of the head of household. It contains consistent information for most variables of interest since 1989, providing data from 10 survey years through 2016 for this analysis.
The data allow for the calculation of a number of indicators that capture a household’s present-day economic insecurity. The SCF, for instance, asks people whether their income was above or below normal in the previous year. Below-normal income then reflects a negative income shock, while above-normal income is a positive income shock. Furthermore, the data set asks people how long they have worked with their current employer, which is a sign of employment stability. To simplify the analysis, this brief groups people into age groups spanning 10 years—25 to 34 years; 35 to 44 years; 45 to 54 years; 55 to 64 years; and 65 and older. A household is considered to have a short tenure with its current employee if it has been working with the employer shorter than at least three-quarters of other individuals in the same age group. Moreover, the SCF’s details on household assets provide enough information to separate out liquid assets, such as checking accounts, savings accounts, and money market mutual funds. This brief considers all liquid assets as emergency savings, which is a rather broad definition and thus probably understates households’ economic insecurity. A household is defined as having low emergency savings if its liquid assets equal less than one month of income. Finally, in this brief, households are considered to have high debt payments if they pay more than one-third of their income in interest and principal.
This brief uses several measures of household wealth to capture wealth inequality and future economic insecurity. Wealth is the difference between all financial and nonfinancial assets, such as cars and all debt. The wealth measured in this brief includes average wealth; median wealth; the median wealth-to-income ratio; wealth at the 20th percentile; wealth at the 90th percentile; the share of households with no or negative wealth; the homeownership rate; the share of households who owe more on their house than the house is worth; the share of households with a retirement account such as a 401(k) plan or an individual retirement account; and the median balance in such accounts.
A number of indicators of spending, savings behavior, and financial attitudes round out the data discussion. These include an indicator of whether the family spends more than their income, as well as an indicator of whether the household forewent health insurance for somebody within the household due to economic reasons as measures of whether negative income volatility puts extra demands on household consumption. Economic reasons include lack of money, layoffs, and loss of public assistance. This measure serves as an indicator of severe spending cuts due to economic reasons. The data also include an indicator of whether families participate in a retirement plan at work and shows how much they and their employers contribute to those plans. This captures whether those with negative income shocks are less likely to have access and/or qualify for such benefits. Moreover, the data include an indicator of whether the family saves regular or irregular amounts and an indicator of whether the household has a financial planning horizon of five years or longer. These measures capture whether families with negative income shocks are more likely to focus on short-term financial planning than are families without negative income shocks.
The analysis only includes non-retired households from the ages of 25 to 65 years to capture potential labor force participation. The data summary also groups the data by years—specifically from 1989 to 1998; from 2001 to 2007; and from 2010 to 2016. The break points coincide with the past two recessions. Grouping the data by years allows for sufficient sample sizes and simplifies the discussion. Using data for individual years instead of grouped data does not change the conclusions.