Introduction and summary
People need to save large amounts of money to pay for common life events such as retirement, their kids’ college educations, and unforeseen emergencies. Yet many households have little or no savings, while others have accumulated enough to have secure economic futures. Wealth is also unequally distributed by gender, such that women—both single and married—tend to have less wealth than single or married men.
One often-cited explanation for women’s lower savings is that women may take too few financial risks. For example, they invest less in stocks than men do.1 Women, then, have fewer chances to see stock market gains, the argument goes, which, on average, could result in less wealth than is the case for similarly situated men.
This argument overlooks that women can have more exposure to economic risks than men in other areas—for instance, in their jobs and through caregiving. (see Figure 1) Risks involved with jobs include sudden drops in earnings and frequent or lengthy unemployment spells. The economic risk exposure associated with caregiving is the possibility of an unexpected drop in income and savings or an increase in debt because of unanticipated caregiving responsibilities. These risk exposures are hard to avoid, and they come with more unexpected losses in income than with potential income gains.

Economic risk exposures can have negative effects on people’s savings, something which affects their long-term economic well-being, especially if people face a lot of downside risks—the chance of losing savings and income. This can happen with financial investments if people make unlucky or unwise decisions and thus incur more exposure to risk than they ideally would like. One example of such behavioral obstacles is inertia—not doing anything, even when circumstances change. People may hold more stocks than they want to in a retirement account because they do not sell stocks and invest in less risky investments after stock prices go up substantially. When stock prices subsequently fall, people lose more money than they had wanted to put at risk. Moreover, other risks in the labor market and through caregiving are hard to avoid, resulting in income and savings losses when the labor market turns sour or when unexpected caregiving responsibilities arise.
High risk exposure can also have negative effects on savings if it leads people to worry more about the short term than the long term. Having a lot of financial risk exposure through investments, as well as exposure to labor market uncertainties and caregiving responsibilities, may overwhelm people and lead them to focus on the short term, ultimately hampering their savings.
Women tend to be more likely than men to face a lot of downside risk exposure. Compared with men, they face more caregiving responsibilities and more labor market risk exposure—risk exposures that are hard to avoid and that carry more downside risks than upside benefits. Moreover, women often also face more financial risks than is the case for men; this is the case, for example, when they own real estate or run their own business. Women end up with less savings than men, possibly in part because they face more economic downside risks in their lives rather than because they simply are not adept at saving.
This report summarizes nationally representative economic data for women and men and their exposure to a number of economic risks, showing that:
- Women have more exposure to hard-to-avoid risks than men
- Women are more likely than men to face several economic risks at once
- Women’s exposure to all economic risks has grown over time
- Greater risk exposure goes along with fewer risk protections for women
- Women with high risk exposure have less in savings than women with less risk exposure
These analyses lend even more support to arguments for policies that can help reduce women’s risk exposure from caregiving and in the labor market. Such policies include paid family and medical leave, easier access to employer-sponsored benefits for part-time workers, and increases in the minimum wage and more opportunities to join a union. These policies would help lower risk exposure for women and men with caregiving responsibilities and economically precarious jobs. Lowering men’s risk exposure associated with caregiving can also help ease women’s caregiving responsibilities by making it more likely that men can become caregivers.2
Women's risk exposure
Women are less likely than men to have enough savings to weather an economic emergency and to maintain their standard of living3 and avoid poverty in retirement.4 Several academic studies have suggested that this disparity results from women’s lower willingness to take financial risks because they, for example, invest less of their savings in stocks than men do.5 Economic risk is the possibility of unexpected income losses—and gains—in the future. Such losses can occur in the stock market, in the housing market, and through business ownership—if people decide to invest in stocks, real estate, or private businesses.
The narrow view that women have too little risk exposure, though, likely understates women’s total risk exposure. Women, for example, are more likely than men to experience labor market uncertainty. On average, women have lower pay,6 shorter job tenure,7 and lower labor force participation8 than men. Women are also more likely to have child care9 and/or elder care10 responsibilities than is the case for men. Caregiving responsibilities may lead to uncertain income losses as people need to take unpaid time off,11 withdraw from the labor force,12 or rely on savings or debt to cover unexpected caregiving expenses.
Moreover, risk exposure in the labor market and through caregiving responsibilities is hard for people to avoid. Since most people have to work for a living, it is difficult to get out of having labor market risks. And caregiving risks are hard to manage in an environment where few workers enjoy the necessary benefits to manage unexpected demands on their time as caregivers. Also, as noted above, these hard-to-avoid risks come with the chance of substantial income and savings losses, over time lowering savings below where they would be otherwise.
Furthermore, married women face some additional sources of risk exposure compared with single women. Specifically, married women face the risks of widowhood and divorce. While married men also have risk exposure associated with the end of a marriage, women are more likely than men to be widowed13 and less likely to remarry after getting divorced or being widowed.14
Even considering the economic magnitude of the effect—not just the frequency—of being widowed or divorced, men seem to fare better than women. Both widowhood and divorce typically result in a greater loss of income and savings for women than for men.15 Data from 2013 show that older widows are twice as likely to live in poverty as older widowers—people 50 years old and older—partially due to reductions in income from Social Security and defined benefit, or DB, pensions upon a spouse’s death, which particularly affect women.16 Furthermore, divorce causes disproportionate economic hardships for women because women are more likely than men to interrupt their careers during a marriage—for instance, to take care of children.17 If risk exposures indeed matter for savings, those women who become widowed or divorced should still have less wealth than similarly situated men.
Ideally, women would have more risk protections than men—for instance, in the form of more DB pensions and health insurance coverage—to offset their additional risk exposure. The existing evidence, however, suggests that single women have fewer such risk protections than is the case for single men.18 Married women generally have greater access to such risk protections than single women, since they have access to their spouses’ income and savings. Yet married women are still likely to have less savings than married men, possibly due to more risk exposure and fewer risk protections.
Risk exposure can adversely affect savings through two channels. First, people could face more downside risks than upside risks. The chance of unexpected financial losses outweighs potential unexpected economic gains, as far as they exist, with respect to labor market risk exposures and caregiving responsibilities. Risk exposure in the financial and housing markets offers greater opportunities for financial gains than labor market and caregiving risk exposure. However, people could take on unintentionally substantial downside risks due to behavioral obstacles. For instance, at a time of rising stock and housing prices, a growing share of people’s assets may be invested in these risky assets. This could expose people to the possibility of substantial and undesired financial losses when these markets decline.19 Second, people with a lot of exposure to downside risks could become increasingly focused on short-term concerns, thus forgoing long-term savings.
Both channels are more likely to apply to women than to men. First, women tend to already experience more risk exposure in their savings than is the case for men. The exposure to risks associated with housing and business investments suggests that women may actually have more of their savings at stake than is the case for men once they buy a house or start a business. Some studies suggest that housing makes up a larger proportion of single women’s assets than men’s, since, on average, women have lower overall savings than men do.20 Furthermore, data from 2010 show that single women had higher debt-to-income ratios than single men,21 which exacerbates the financial risks associated with housing. Women-owned businesses are also more likely to fail than those owned by men, in part due to less access to credit.22 Second, women are more likely to face labor market uncertainties and caregiving responsibilities, as discussed above.
In addition to women facing each of these additional risks, there is also the question of whether women are more likely than men to be exposed to multiple economic risks, which could possibly lead women to focus more on the short term and forgo savings.
This report’s research looks at whether women have more overall economic risk exposure than men. It also analyzes whether women with a lot of risk exposure have similar or even more risk protections, such as emergency savings, pensions, life insurance, and health insurance. It further studies whether women with high risk exposure focus more on the short term and are less likely to self-identify as savers than women without high risk exposure. If women with more risk exposure are not focusing more on savings and if women indeed have more risk exposure than men, and if that additional risk exposure is not compensated for by additional risk protections, women’s overall savings could be lower than is the case for men—especially in longer-term savings, such as retirement accounts and housing. The empirical section of this report shows the data on these various linkages that connect economic risk exposure and savings by gender. Finally, the report addresses how various policies can mitigate or offset these risks that women disproportionately bear.
Women have less wealth compared to men
Wealth is unequally distributed between men and women. Figure 2 shows median wealth in 2013 dollars23—excluding defined benefit pensions—for women and men from 1989 to 2013, the last year for which data are available.24 The data are reported separately for single and married women and men, since married women and men tend to have more wealth than single women and men.25
The data in Figure 2 show that women consistently have less wealth than men. Single women only had wealth worth $5,870 in 2013, compared with $11,800 for single men at that time. These amounts are significantly lower than the $38,450 for married women and the $45,050 for married men.
The data also show that single women had less wealth than single men from 1989 to 2013 and that the wealth gap was larger between single women and single men than between married women and married men (see Figure 2), which is not surprising considering that married women and men share a fair amount of their wealth.26
Moreover, there is no clear upward trend in wealth for any of the four groups. (see Figure 2) This stagnation is striking, since the need for more savings has gone up as the average lifespan has increased, DB pensions have disappeared, health care costs have continued to rise faster than incomes, and the value of Social Security benefits has gradually declined since 2000 due to increases in the full-benefit retirement age.
Economic insecurity is growing, and wealth is not keeping pace with people’s growing economic needs. This is reflected in estimates of growing retirement income insecurity, showing a rising share of households unable to maintain their standard of living in retirement and facing substantial and painful spending cuts when they retire.27 These estimates also show that single women are not as prepared for retirement as single men.28
Risk exposure is greater for women than for men
Risk exposure could be particularly harmful to the long-term economic well-being of women if it correlates with lower savings. This analysis focuses on data on women’s and men’s economic risk exposure to see whether risk exposure is linked to savings. It first includes data on the risk exposure of women and men, specifically savings risk exposure—from investments in stocks, real estate, and business—labor market risk exposure, and caregiving risk exposure. In particular, the data show the likelihood of experiencing a particular form of risk exposure for women compared with men. The data also show the potential losses that could ensue from the total risk exposure within the subsequent 12 months and from hard-to-avoid risk exposure in the labor market and through caregiving responsibilities.29 Next, the data show the correlation between savings risk exposure and other risk exposure to see whether women who face hard-to-avoid risk exposure lower their easier-to-manage savings risk exposure when facing hard-to-avoid risks. Furthermore, the data show the linkages between high risk exposure and risk protections to analyze whether women with more risk exposure have more or fewer risk protections than women with less risk exposure. Moreover, the data summarize a number of key attitudes that can determine savings, such as people’s long-term planning horizons based on risk exposure for single women and single men.30 The discussion closes with a look at the potential connections between risk exposure and household wealth.
Risk exposure measures by gender, marital status, and time period
Table 1 shows the summary risk indicators for savings, caregiving, and labor market risk exposure for all nonretired women and men, broken down by marital status and time period—early years from 1989 to 1998 and later years from 2001 to 2013.31 Single women have more risk exposure than single men.32 Single women, for instance, had an 11 percent chance of simultaneously facing high savings risk exposure from investments in real estate, stocks, and businesses; high unemployment; and caregiving risk exposure between 2001 and 2013, compared with 3.9 percent for single men. That is, women were almost three times as likely as men to have concentrated risk exposure, or simultaneous exposure to multiple risks. Single women also had a 76.4 percent chance of being exposed to at least one of the three risks—known as diverse risk exposure—compared with 72.1 percent for single men.
Single women had a 10 percent likelihood of losing at least $3,552 in the later years, which equaled 12.7 percent of their earnings, compared with $3,453 for single men, or the equivalent of 9.3 percent of earnings. This gap in value at risk—the money that people could expect to lose with a 10 percent likelihood during the next year—is even more pronounced when looking only at hard-to-avoid labor market risks and caregiving responsibilities. Single women could expect to lose $2,882 (in 2013 dollars), or 9.4 percent of their earnings during the later years, compared with $2,030, or 5.1 percent of earnings, for single men. Importantly, these potential losses could be recurring, since caregiving responsibilities, for instance, can last for several years.
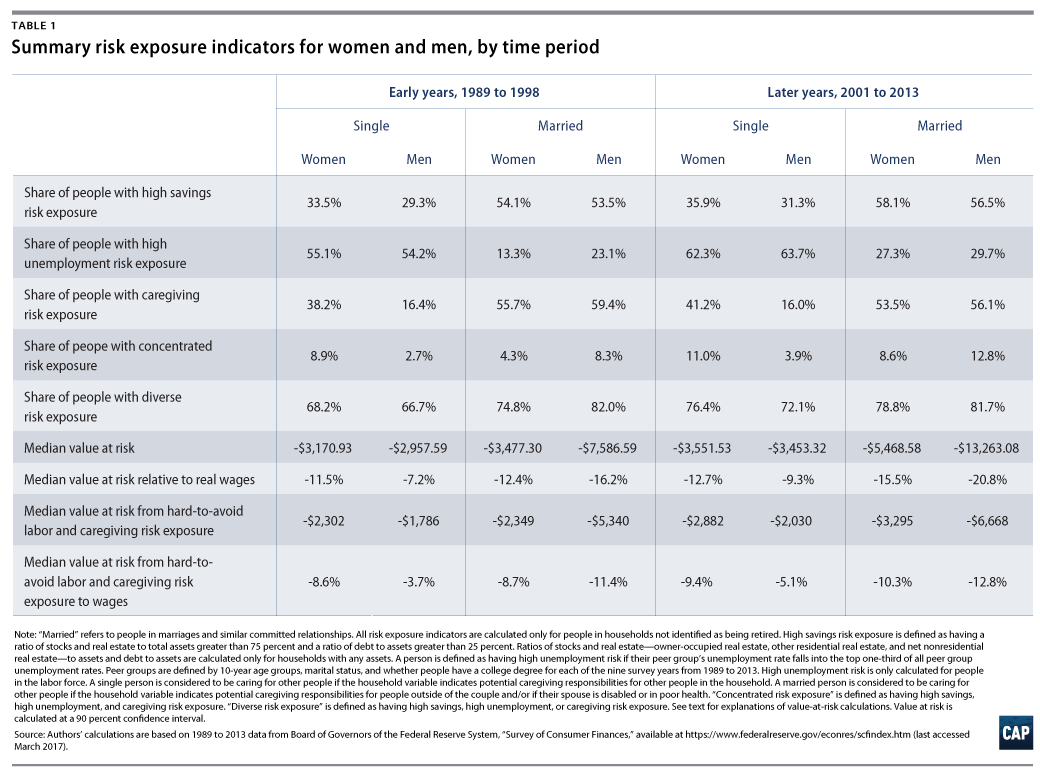
The data on married women and married men lead to somewhat different conclusions. Married women have less risk exposure than married men.33 The share of married women with simultaneous exposure to all savings, unemployment, and caregiving risks—referred to as concentrated risk exposure—was 8.6 percent between 2001 and 2013, while the respective share for married men was 12.8 percent during that time period. (see Table 1) This results from fewer stock and business investments by married women than by married men and a slightly lower chance of having caregiving responsibilities, possibly because married men are more likely to live with an ailing spouse than is the case for married women.34 Furthermore, caregiving risk exposure does not capture any difference in the impact of shared caregiving responsibilities on each spouse within a married couple but simply measures the chance of having any caregiving responsibilities.35 Put differently, the measure may overstate the caregiving risk exposure for married men and understate it for married women.
The value at risk is also greater for married men than for married women. Married women could potentially lose $5,469 in 2013 dollars, or 15.5 percent of their earnings, compared with $13,263, or 20.8 percent, of a married man’s earnings during the later years. (see Table 1) This gap emerges in large part because men earn more money and have more assets, so potential losses, which the authors calculated relative to earnings or assets, are also greater.36
The gap in potential losses shrinks when we consider only hard-to-avoid exposure to risks, such as the chance of becoming unemployed. The potential losses from hard-to-avoid labor market risks and caregiving responsibilities amount to 10.3 percent of earnings for married women during the later years and to 12.8 percent for married men during the later years. This gap related to hard-to-avoid risk exposures is smaller between married women and married men than the difference in total potential losses. (see Table 1) Risk exposure resulting from labor market risk factors and caregiving responsibilities makes up a greater share of the potential losses for married women than for married men. In turn, the large differences in the composition of risk exposure among married couples in the later years follow to a high degree from differences in stock and business investments prior to the Great Recession from 2007 to 2009, since married men had more of such investments than married women.
Moreover, the aggregate risk exposure measures for total risk exposure for married women do not account seperately for the possibility of widowhood or divorce, which poses a larger economic risk to married women than to married men. This report briefly considers household wealth for the later years for women and men, broken down by marital status, divorce, and widowhood for nonretired women and men ages 50 and older. (see Figure 3) We use only the data for older women and men to make sure that there are sufficient comparison points between married and widowed or divorced women and men.37
The data in Figure 3 suggest that widowhood and divorce pose a particularly large economic risk for women. First, wealth declines with widowhood and divorce. The figure shows that married women and men have substantially more wealth than widows and widowers, who have more wealth than divorced women and men. Second, the decline in wealth with widowhood and divorce is greater for women than for men. The median wealth of widowers is 93.3 percent that of married men, while the median wealth of widows is 74.2 percent that of married women. In sum, the data in Table 1 overstate the differences in the potential losses from risk exposure between married women and men, since they do not account for changes in economic risk exposure upon the end of a marriage.

Furthermore, risk exposure has increased over time for both women and men. (see Table 1) The gap in concentrated and diverse risk exposure by gender has grown, as has the value at risk for single and married women and men. That is, economic risk exposure has become more pronounced at a time when key economic markets—stock, housing, and labor markets—also became more volatile. This is like pushing people into the ocean just as a major storm gets underway.
Women experience risk exposure from all sides following hard-to-avoid risk exposures
How do hard-to-avoid risk exposures correlate with savings risk exposure? Table 2 shows women’s savings risk exposure conditional on hard-to-avoid risk exposures. Women who have high unemployment risk exposure and/or caregiving risk exposure generally have higher savings risk exposure through investments in stocks, real estate, and businesses than those women with less unemployment and/or caregiving risk exposures.38 That is, many women are exposed to more than one risk, especially when they experience high unemployment and/or caregiving risk exposures, which are harder to avoid and manage than savings risk exposure. Women incur increasingly concentrated risk exposure, as Table 1 already showed, because of hard-to-avoid risk exposure in the labor market and through caregiving.

Women with more risk exposure have fewer risk protections
The conclusion of women having more concentrated risk exposures—following hard-to-avoid risk exposures—would be less worrisome for women’s savings if women with high risk exposures had more risk protections.39 Table 3, which appears in the report PDF, directly compares risk protections and risk exposures for women by splitting the sample by the chance of high unemployment and then again by caregiving risk exposure, dividing each group into women with high risk exposure and women without it.40 Table 3 then reports data on risk protections for each subsample.
The ratios of risk protections for women without high risk exposure to those for women with high risk exposure are most relevant for the purpose of understanding how risk protections correlate with risk exposures. Ratios greater than 100 percent would suggest that women without high risk exposure are more likely to have a particular risk protection than women with high risk exposure. A ratio of less than 100 percent would indicate that risk protections positively correlate with risk exposures—that women with high risk exposures are also more likely to have risk protections.
What we find is that women with high risk exposures in the labor market and through caregiving generally have fewer risk protections than women with less risk exposure. (see Table 3 in the PDF) First, women with high unemployment risk exposure generally have fewer risk protections, such as health insurance and defined benefit pensions, than women with less unemployment risk exposure. The gaps tend to be especially pronounced for single women compared with married women, as indicated by single women’s higher ratios of risk protection coverage for those with and without risk exposure during the later years. Married women also enjoy risk protections through access to their spouses’ income and savings. Second, women with caregiving risk exposure similarly tend to have fewer risk protections than women without them. Single women with caregiving responsibilities, for instance, had a median liquid asset balance of $1,048 between 2001 and 2013, compared with $2,246 for those without caregiving risk exposure. The data suggest that single women are more likely to be on their own in facing risk exposures than is the case for married women.
Whether single or married, women with high risk exposures have fewer risk protections than women without high risk exposures. This negative correlation between risk exposure and risk protections appears to have remained stable and possibly worsened over time, just as risks and risk exposure became more widespread. (see Table 3)
Fewer beneficial savings attitudes among women with high risk exposure
High risk exposure, especially without risk protections, can influence people’s attitudes toward the future. People with high risk exposure may have more of a short-term focus than would be the case with less risk exposure, which could also influence their willingness to save.41
Table 4 summarizes single women’s willingness to save regularly or irregularly and the chance of them having a long-term financial planning horizon greater than five years.42 These differences are more pronounced in hard-to-avoid risk exposures, such as unemployment and caregiving, than for savings risk exposure. Women with more risk exposure regularly are less likely to self-identify as savers and tend to have shorter planning horizons. (see Table 4) Moreover, in almost all cases, the differences are greater for the hard-to-avoid risk exposures—including unemployment and caregiving responsibilities—than for savings risk exposure through investments in stocks, real estate, and businesses. This suggests that high risk exposure may impede future savings, due to a lower willingness to save and shorter planning horizons.
Risk exposure and household wealth
Finally, risk exposure may be linked to savings, specifically median wealth, median retirement assets, and mean homeownership rates. Table 5, which appears in the report PDF, shows these median wealth numbers broken down by high savings, high unemployment, and caregiving risk exposure for single and married women. Women with high risk exposure typically have fewer savings than women with less risk exposure, as indicated by percentages less than 100 percent in the “with risk to without it” column.43
We would expect that exposure to hard-to-avoid risks in the labor market or through caregiving correlates with a larger wealth gap than exposure to savings risks, which are easier to avoid. Single women with caregiving risk exposure have only 3.3 percent of the wealth—$1,000 compared with $30,644—that single women without caregiving risk exposure had in the later years. The comparable ratio for unemployment risk exposure during those years was 4.7 percent—or $3,050 to $64,570. It was 131.7 percent for savings risk exposure—$13,837 to $10,506. (see Table 5 in the PDF) Furthermore, single women with caregiving risk exposure had 45.8 percent of the median retirement savings—$11,879 to $25,721—of single women without caregiving risk exposure during the later years. By comparison, single women with high unemployment risk exposure had 63.6 percent of the retirement savings of single women without high unemployment risk exposure. Single women with high savings risk exposure had 65 percent of the retirement savings of single women with lower savings risk exposure. That is, hard-to-avoid risk exposure, especially through caregiving, goes along with less savings for single women than easier-to-avoid risk exposure.
The data for married women in Table 5 also show that married women with more risk exposure tend to have less wealth than married women with less risk exposure, as the relevant ratios are all below 100 percent. This is true for all forms of risk exposure—savings, unemployment, and caregiving.
The differences in wealth gaps, though, vary from those observed for single women. The data for total wealth and retirement savings indicate that the wealth gaps are more pronounced in relation to hard-to-avoid risk exposures than is the case with easier-to-avoid risk exposure.44 Single women have less wealth and less retirement savings when they face exposure to hard-to-avoid risks—for instance, in the labor market and through caregiving—than is the case with easier-to-avoid risks through investments in stock, real estate, and businesses. During the later years, for instance, married women with caregiving risk exposure had 66.6 percent of the retirement savings—$19,698 to $29,595—that married women without caregiving risk exposure had at the same time. This compares with a ratio of 27.2 percent—$12,738 to $46,895—for the retirement savings of married women with high savings risk exposure to the retirement savings of married women without high savings risk exposure. (see Table 5)
The summary data, though, mask a few important details that suggest that many married women face substantial risk exposures amid low savings. First, the correlation of married women’s high savings risk exposure with low wealth is reinforced by their spouses’ high savings risk exposure and low wealth. Among the husbands of married women with high risk exposure, 87.7 percent had high savings risk exposure themselves between 2001 and 2013, compared with 8.9 percent of married men whose spouses were without such risk exposure. At the same time, the husbands of married women with high savings risk exposure also tend to have a lot less wealth, with $81,153 between 2001 and 2013, than the husbands of married women without savings risk exposure, with $611,267.45 Second, married women with high savings risk exposure have a lot more debt and fewer assets than is the case for married women without high savings risk exposure.46 Third, married women with high savings risk exposure also tend to live in households with lower incomes. Finally, they live in households headed by somebody with shorter planning horizons and lower savings probabilities more often than is the case for married women without high savings risk exposure. The compilation of these data suggests that married women with high savings risk exposure live in households that struggle to save and incur large amounts of debt to make ends meet, rather than to build wealth.47 Spouses’ high savings risk exposure and low savings, then, reinforce married women’s correlation between savings risk exposure and savings.
It is also important to note that married women with hard-to-avoid risk exposures enjoy additional risk protections from their spouses’ income and savings. Those risk exposures, then, likely have smaller adverse effects on married women than on single women. That is, even in the face of hard-to-avoid risk exposure, married women may enjoy more economic security than single women. However, as was discussed above, some of this economic security is liable to diminish upon widowhood or divorce.
Conclusion and policy implications
This report considers women’s exposure to a number of economic risks—through investing in stocks, real estate, and businesses; in the labor market; and through caregiving responsibilities. Women are especially likely to increasingly face hard-to-avoid risks in the labor market and through caregiving. Single women are particularly vulnerable to such risks, especially since they have few savings and fewer risk protections than single men or married women.
The data further suggest that married women also face substantial economic risks that can harm their long-term economic security. Married women face more economic risks than single women, since they are more likely to face risks from investments in stocks, real estate, and businesses, as well as through caregiving responsibilities. They additionally face the risk of becoming widowed or divorced, which can disproportionately—relative to men—harm their finances. And married women with a lot of risk exposure through their investments appear to live in households with low savings, high debt, and lower incomes, suggesting that they and their spouses already struggle financially. Many married women often are in an economically precarious situation.
The data suggest that economic risk exposure correlates with fewer savings. And changes in women’s risk exposures from a variety of sources have exacerbated the potential adverse consequences of volatile labor, stock, and housing markets for women’s savings over the past decades, just as labor, stock, and housing markets have become more volatile. There is a need for policy interventions to reduce wealth inequality by gender.
This report’s discussion contains two key lessons that can inform policies to reduce the adverse effects of women’s risk exposure. Policy can create more risk protections by lowering the chance of being exposed to economic risks, by reducing the potential losses associated with economic risk exposure, and by helping women manage overlapping risk exposures.
Reducing the chance of risk exposure is easier with respect to risks that people can avoid or reduce on their own, such as savings risk exposure. This could happen, for instance, through automatic default investments in retirement savings that hold stock market risk exposure constant. It could also happen through programs and incentives that help women save money in general—especially liquid savings for emergencies—and mitigate the risks associated with investments.
For other risk exposure, especially in the labor market and through caregiving, it is substantially more difficult if not impossible to lower the chance of risk exposure. In those instances, policy could focus on reducing the expected economic losses from risk exposure. This could happen through improved unemployment insurance and continued learning programs that could enhance job mobility and job re-entry. In addition, more paid time off and greater and more systematic use of flexible work arrangements to accommodate women’s expected and unexpected caregiving needs could lower the economic costs associated with caregiving responsibilities.
Finally, risk exposures are more likely to overlap for single women than is the case for single men. Policy can directly address the chance of being exposed to one particular economic risk and the value of the losses associated with risk exposure. But it is difficult and often nearly impossible to design policies that can help women balance a variety of risk exposures. Strong social insurance programs; efficient savings policies; and cogent, cost-effective, and nonself-interested financial advice can likely help women manage their exposure to a variety of economic risks.
The exposure to risks has grown just as the chance of these risks has gone up; therefore, it will take a serious rethinking of policy to improve women’s savings substantially and thus their future economic security. Without new efforts to reduce economic risk exposure, women will experience rising economic insecurity now and in the future due to the long-term effects of their current economic uncertainty. Importantly, because women often face multiple risks at the same time, policymakers will need to consider addressing women’s economic security through a range of policies.48
About the authors
Christian E. Weller is a Senior Fellow at the Center for American Progress and a professor of public policy in the John W. McCormack Graduate School of Policy and Global Studies at the University of Massachusetts Boston. He is an expert on retirement income, wealth inequality, and economic policy.
Michele E. Tolson is a doctoral candidate in the Department of Public Policy and Public Affairs at the University of Massachusetts Boston. Her research focuses on economic inequality and social insurance.
Appendix A: Data and variables
Data set
We use the Board of Governors of the Federal Reserve System’s triennial Survey of Consumer Finances, or SCF, a nationally representative household survey, as our data source. The SCF is a cross-sectional data set repeated every three years that oversamples wealthy households to get an accurate picture of total U.S. wealth. Household weights are designed to capture the entire U.S. population and all of its assets.49 In 2013, the SCF included 6,026 households, of which 1,458 cases were selected to represent relatively wealthy households.50 The SCF imputes missing data and generates five replicates of each observation, each with a different weight, to increase the sample size and the number of usable observations fivefold. The total weights for each of the five replicates are designed to add to the population total. Analysts typically use an average of the five weights of each of the five replicates to use all replicates and still arrive at a total that equals the entire population in a given survey year.
The SCF focuses on household finances, especially people’s savings and their debt. It contains, for example, detailed information on households’ home ownership, outstanding mortgages, retirement savings, coverage through defined benefit pensions, and other financial assets, as well as the share of all financial assets invested in stocks. The SCF further includes information on people’s wages and employment status. It also contains data on caregiving responsibilities and financial support for family members. Consistent data are available from 1989 to 2013. The wealth of consistently available information for each household in the SCF makes it an ideal data set to study economic risk exposure and risk protections, as well as changes in risk exposure over time.
Key variables
We consider married and single women and men and their risk exposure in the analysis. The SCF collects information on respondents’ reported gender, as well as the gender of their spouse. The SCF also contains demographic variables, such as age, education, and ethnicity for the respondents and their spouses, where applicable. Data on race and ethnicity exist only for respondents. The term “married” refers to people in marriages and other similar committed relationships. The data also breaks down for retirement savings balances; stock market investments in retirement accounts; some financial assets such as checking, savings, and money market accounts; employment; unemployment; and wages for each spouse in married couples.
The SCF contains a wealth of information, much of which allows us to separate out individual risk exposure in savings, labor market, and caregiving. In a number of instances, we are unable to allocate individual risk exposures to spouses within married couples, and in those cases, we often split the risk exposure evenly between spouses.
To make the discussion a little easier to follow, we group the data into early years, 1989 to 1998, and later years, 2001 to 2013, since the recession of 2001 marks the onset of increased stock, housing, and labor market risks and risk exposure.
Individual risk exposure measures
We designed a number of detailed economic risk exposure measures. We measure savings risk exposure by the share of stocks out of financial assets, the share of stocks plus real estate—owner-occupied housing, other residential real estate, and net nonresidential real estate—and business out of total assets and the ratio of debt to assets.
The SCF allows us to allocate a range of financial assets to each spouse in a married couple. These include retirement accounts and liquid savings, such as money market mutual funds, checking accounts, and indirectly held stocks in retirement accounts.
In comparison, we cannot allocate direct stock holdings, real estate ownership, and passive business ownership to spouses in a married couple. In those instances, we evenly split the assets between spouses.
We allocate actively managed businesses in married couples as follows. We split the value of the business evenly between spouses if they both work in the business. Alternatively, we allocate 75 percent of the asset to the spouse that works in the business if only one spouse works in said business. With this split, we attempt to capture the greater risk exposure due to both savings and income being risky for the spouse that works in an actively managed business.
We estimate labor market risk exposure by the probability of annual earnings to fall by $5,000 in 2013 dollars below their current level, based on average earnings and the standard error for a person’s peer group—defined further below. We also consider the unemployment rate and length of unemployment for the relevant subpopulations as labor market risk exposure measures. Additionally, we report the likelihood of being caregivers and of financially supporting family members as detailed measures of caregiving risk exposure.
Finally, we use the probability of caring for somebody and the chance of financially supporting somebody as indicators of caregiving responsibilities. The SCF does not allow us to split caregiving responsibilities between spouses nor the amount of financial support for other family members. We consider both spouses as caregivers and as financially supporting other family members if the respective variables indicate that the household cares for family members or supports them financially. These cared-for family members include children, grandchildren, nieces, nephews, and foster children younger than age 19, if they live in the household. They also include parents, grandparents, aunts, and uncles living in the household. We further assume that husbands care for wives or partners if the wife or partner is disabled or indicates being in poor health. Similarly, we assume that wives or partners care for husbands if the husband is disabled or indicates being in poor health. Financial support for family members includes support for any family member not living in the household. We cannot allocate this responsibility between spouses in a married couple and thus assign equal probability to both spouses.
Summary risk exposure measure
We use several summary risk exposure indicators in our analyses to keep the presentation manageable. We first define people as having high savings risk exposure if stocks, real estate, and businesses make up more than 75 percent of their assets and they owe more than 25 percent of their assets in debt. We further define a person as having high unemployment risk exposure if they belong to a peer group that has an unemployment rate in a specific survey year in the top one-third of all peer-group unemployment rates across all nine survey years from 1989 to 2013. We define peer groups here by age (younger than 30, 30 to 39, 40 to 49, 50 to 59, or 60 and older), race/ethnicity (white and non-Hispanic or other), and education (at least a college degree or no college degree) for each of the nine survey years. Alternatively, we define peer groups for the purposes of calculating high earnings risk exposure by age (younger than 30, 30 to 39, 40 to 49, 50 to 59, or 60 and older), race/ethnicity (white and non-Hispanic or other), education (at least a college degree or no college degree), and income quintile for each of the nine survey years. Moreover, we use only the chance of having caregiving responsibilities as caregiving risk exposure for most of the report, since it is more widespread than the probability of financially supporting family members.
We combine these summary risk exposure measures into one indicator for concentrated risk exposure and one for diverse risk exposure. We define concentrated risk exposure as the chance of people being simultaneously exposed to high savings, high unemployment, and caregiving risk.51 In comparison, diverse risk exposure means having at least one of these three risk exposures.52
Value-at-risk calculation
We also attach a dollar value to people’s total risk exposure. We specifically calculate the total money that people could reasonably lose within the next year if risks materialized. This approach is often referred to as “value at risk” in financial economics. It allows us to put a dollar value on each form of risk exposure, measuring how much money people could potentially lose with some degree of probability. This makes it possible to compare various forms of risk exposure with each other and add the total potential losses across all forms of risk exposure with each other.
We specifically calculate the minimum amount of money that people could expect to lose in 10 percent of likely future instances, given past experiences. That is, in 10 percent of possible outcomes in the future, people’s losses could be greater than the amount we calculate. On the other hand, people can expect to have more money—smaller losses or even gains—in 90 percent of the cases than the number we calculate. Since people tend to be risk averse, they generally want to know what the worst-case scenario is. Our value-at-risk number implies that people can have confidence that in 90 percent of potential future outcomes, they will be better off and in 10 percent they will be worse off if risks in savings, the labor market, and caregiving materialize.53
It is important to keep in mind that we calculate the chances of changes with 90 percent confidence. People can expect that their economic outcomes—savings and earnings—will either grow more or lose less than the value-at-risk amount 90 percent of the time. To calculate the dollar amounts associated with these probabilities of changes, we use different approaches for savings risk exposure, labor market risk exposure, and caregiving risk exposure.
First, for investments in stocks, businesses, and housing, we calculate the average rate of appreciation and the associated standard error over the 30 years leading up to each respective survey year. For instance, we calculate the annualized average rate of growth of stocks and its standard error, based on the S&P 500, from September 1975 to September 2010 to calculate the risk exposure associated with stock investments in 2010. We repeat this process for all other survey years from 1989 to 2013. Because we do not have a comparable index for privately held businesses, we use our calculations for stocks to also compute the value at risk for privately held businesses. We further calculate the average rate of growth of house prices and their standard error, based on the Case-Shiller Composite Home Price Index, for the 30 years leading up to each survey year. We use these calculations to compute the value at risk for owner-occupied housing, other residential real estate such as vacation homes, and for other real estate such as rental properties. In each instance—stocks, businesses, and housing—we calculate the dollar value associated with a 10 percent likelihood of future outcomes based on the average growth rate and the standard error of the growth rate of the associated price—stock prices for stocks and businesses and house prices for all real estate.
Second, we use an analogous approach to calculate labor market risk. We calculate earnings changes relative to current earnings. That is, we calculate the possible losses or gains that people can at least expect in 10 percent of cases. In 90 percent of cases, their losses will be smaller or their gains will be greater, as long as they get paid. In the event that they do not have a job, they will receive no pay and the total loss is equal to their current earnings. The total dollar amount of the relevant earnings loss, then, is the chance of being unemployed times the total current earnings plus the chance of not being unemployed times the difference between current earnings and the expected earnings associated with the 90 percent threshold. We calculate the average earnings and their standard error for the same peer groups, for which we calculate high earnings risk, described above, and then use those numbers to compute the 90 percent threshold.
Third, the value at risk of caregiving risk exposure is the possible loss of earnings from not working for a specific number of days. In cases where people currently do not work for pay, we assume that they draw down savings or borrow money equal to the hours necessary for unexpected caregiving times the federal minimum wage. The literature suggests that, on average, across a range of studies, women lose 40.4 days per year due to caregiving.54 This average of the estimates has an average standard error of 10.3 days per year. The implied lost days with a 10 percent cumulative probability is then 27.2 days. We assume that single women and single men could lose one-third of this, or 9.1 days each year due to unexpected caregiving responsibilities. We further assume that married women could lose one-fifth of the 10 percent threshold, or 5.4 days per year, and married men could lose half the amount of married women, or 2.7 days, to unexpected caregiving needs, which reflects a 2-to-1 caregiving split between married women and married men, as suggested by the existing literature. Married women and married men who care for a disabled or sick spouse or partner, though, could lose 9.1 days, since they do not split caregiving responsibilities in our assumptions.
We then add the value at risk across all risk exposures. We also calculate the median ratio of value at risk to annual earnings.55
Risk protection measures
People can offset their risk exposure with a variety of risk protections and personal savings. We first calculate summary data for a number of risk protections. These include whether people have DB pensions; health insurance; life insurance; and liquid financial assets—which include checking accounts, savings accounts, money market mutual funds, and money market deposit accounts—and the amount saved in these liquid assets. We use whole life insurance policies here, since they can accrue cash values that people can borrow against, in addition to offering key financial protections to family members if not to the person themselves.
We separate DB pension coverage, life insurance, and health insurance coverage between spouses in married couples. We also separate most liquid assets between spouses. Some accounts, though, are in the name of other family members and are considered part of a household’s total assets. In those instances, we allocate half of the account balance to each spouse.
Household savings
Finally, we use four measures of household wealth and assets. We use total wealth, assets minus debt, and assets in retirement savings accounts as well as the homeownership rate. We are only able to allocate parts of household wealth to each spouse in married couples, as discussed before, but we can allocate all retirement savings account balances to each spouse.
Sample
We use all observations for people who do not self-identify as retired or disabled for all survey years from 1989 to 2013. We occasionally restrict the sample further, where appropriate. We calculate, for instance, earnings risk exposure only for people with positive earnings, and we only calculate the value of retirement savings for households that have any such savings.
Appendix B: Table