Economic data continue to highlight three economic policy challenges. First, economic growth remains lackluster by historic comparison, which impedes job creation. Second, many of the people who do have jobs lack adequate wages and decent benefits. Third, some vulnerable population groups suffer more in this economy than their counterparts. Communities of color and people with less education, for example, often struggle with lower wages and higher rates of unemployment than whites and people with more education.
Many of the same policies that strengthen the middle class can also spur faster economic growth. These policies include a higher minimum wage, paid family leave, easier access to collective bargaining, and more profit sharing among employees. Such policies would not only boosts incomes, but also reduce employee turnover and provide employers with additional incentives to invest in their workers. In turn, more skills would translate into faster productivity growth and more robust economic growth.
Building a stronger middle class is only one step toward addressing the triple threat of slow economic growth, weak wage growth, and disproportionate economic struggles. Additional policies include investments in infrastructure and education, as well as creating more opportunities for apprenticeships. The bottom line is that policymakers can do a lot more to build real economic security for families who have struggled through the Great Recession and its aftermath.
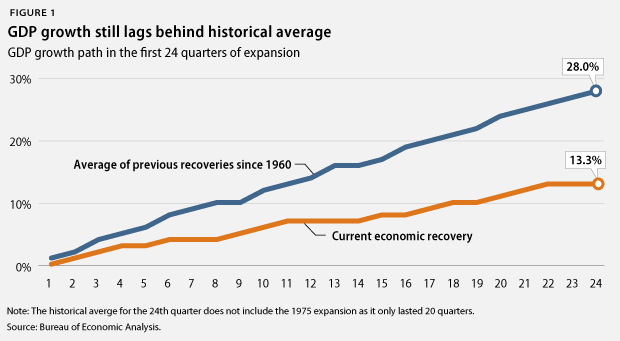
1. Economic growth, while positive, has been uneven and lackluster for years. Gross domestic product, or GDP, increased in the second quarter of 2015 at an inflation-adjusted annual rate of 2.3 percent, after an increase of 0.6 percent in the previous quarter. Domestic consumption increased by an annual rate of 2.9 percent, and housing spending rose by 6.6 percent, while business investment decreased by 0.6 percent. Exports increased by 5.3 percent in the second quarter, while imports increased by a rate of 3.5 percent. Government spending—which is crucial for infrastructure spending on roads, bridges, and schools, as well as for public services such as education, public safety, and transportation—continues to be a weak spot in the economy, as federal government spending fell by 1.1 percent in the second quarter and state and local government spending increased by 2 percent. The economy needs to maintain and even accelerate its momentum in order to create real economic security for America’s families. After all, the economy expanded 13.3 percent from June 2009 to June 2015, far below the average of 28 percent during recoveries of at least equal length.
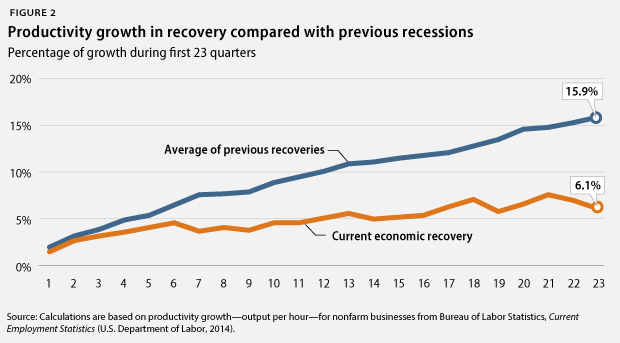
2. Gains to U.S. competitiveness fall behind previous business cycles. Productivity growth, measured as the increase in inflation-adjusted output per hour, is key to strong economic growth over the longer term and to increasing living standards for American families, as it means that workers are getting better at doing more in the same amount of time. Slower productivity growth thus means that new economic resources available to improve living standards and to pay for a wide range of services, such as the retirement of Baby Boomers, are growing more slowly than would be the case with faster productivity growth. U.S. productivity rose 6.1 percent from June 2009 to March 2015, the first 23 quarters of the economic recovery since the end of the Great Recession in June 2009. This compares to an average of 15.9 percent during all previous recoveries of at least equal length. No previous recovery had lower productivity growth than the current one. This slow productivity growth—together with high income inequality—contributes to the widespread sense of economic insecurity and slowing economic mobility.
3. The housing market still operates at a low level. New-home sales amounted to an annual rate of 482,000 in June 2015—an 18.1 percent increase from the 408,000 homes sold in June 2014 but well below the historical average of 698,000 homes sold before the Great Recession. The median new-home price in June 2015 was $281,800, down from one year earlier. Existing-home sales increased by 3.2 percent in May 2015 from one year earlier, and the median price for existing homes was up by 6.5 percent during the same period. Home sales have a lot further to go, given that homeownership in the United States stood at 63.4 percent in the second quarter of 2015, down from 68.2 percent before the start of the recession at the end of 2007. The current homeownership rates are similar to those recorded in 1996, well before the most recent housing bubble started. A strong housing-market recovery can boost economic growth, and there is still plenty of room for the housing market to provide more stimulation to the economy more broadly
4. The outlook for federal budgets improves, which creates breathing room for policymakers. The nonpartisan Congressional Budget Office, or CBO, estimated in March 2015 that the federal government will have a deficit—the difference between taxes and spending—of 2.7 percent of GDP for fiscal year 2015, which runs from October 1, 2014, to September 30, 2015. This deficit projection is slightly down from the deficit of 2.8 percent of GDP for FY 2014. The estimated deficit for FY 2015 is much smaller than deficits in previous years due to a number of measures that policymakers have already taken in order to slow spending growth and raise more revenue than was expected just last year. The improving fiscal outlook should generate breathing room for policymakers to focus their attention on targeted, efficient policies that promote long-term growth and job creation, especially for those groups disproportionately impacted by high unemployment.
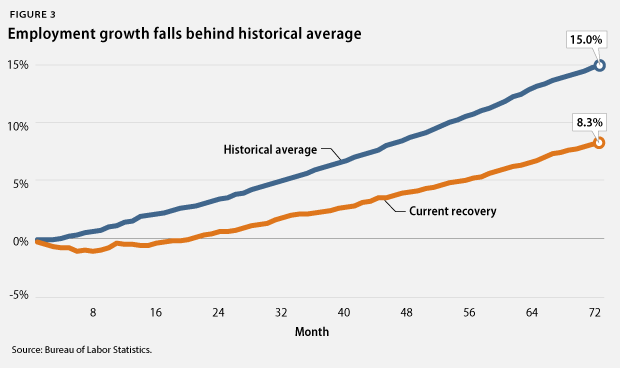
5. Moderate labor-market gains follow in part from modest economic growth. There were 10.9 million more jobs in June 2015 than in June 2009. The private sector added 11.6 million jobs during this period. The loss of some 587,000 state and local government jobs explains the difference between the net gain of all jobs and the private-sector gain in this period. Budget cuts reduced the number of teachers, bus drivers, firefighters, and police officers, among others. The total number of jobs has now grown by 8.3 percent during this recovery, compared to an average of 15 percent during all prior recoveries of at least equal length. Faster economic growth is necessary to generate more labor-market momentum and more well-paying jobs for American families.
6. Employers cut back on health and pension benefits. The share of people with employer-sponsored health insurance dropped from 59.8 percent in 2007 to 53.9 percent in 2013, the most recent year for which data are available. The share of private-sector workers who participated in a retirement plan at work fell to 40.8 percent in 2013, down from 41.5 percent in 2007. Families now have less economic security than they did in the past due to fewer employment-based benefits, not just because of modest job and wage gains. The Affordable Care Act, or ACA—also known as Obamacare—returned a sense of economic security to many households by giving them steady access to quality, affordable health insurance. Policymakers can build on this past success by creating more ways for people to access stable, low-cost, and low-risk retirement savings.
7. Some communities continue to struggle disproportionately from unemployment. The unemployment rate was 5.3 percent in June 2015. The African American unemployment rate fell to 9.5 percent, the Hispanic unemployment rate decreased to 6.6 percent, and the white unemployment rate decreased to 4.6 percent. Meanwhile, youth unemployment increased to 18.1 percent. The unemployment rate for people without a high school diploma stood at 8.2 percent, compared with 5.4 percent for those with a high school degree, 4.2 percent for those with some college education, and 2.5 percent for those with a college degree. Population groups with higher unemployment rates have struggled disproportionately more amid the weak labor market than white workers, older workers, and workers with more education.
8. The rich continue to pull away from most Americans. Incomes of households at the 95th percentile—those with incomes of $196,000 in 2013, the most recent year for which data are available—were more than nine times the incomes of households in the 20th percentile, whose incomes were $20,900. This is the largest gap between the top 5 percent and the bottom 20 percent of households since the U.S. Census Bureau started keeping records in 1967. Median inflation-adjusted household income stood at $51,939 in 2013, its lowest level in inflation-adjusted dollars since 1995.
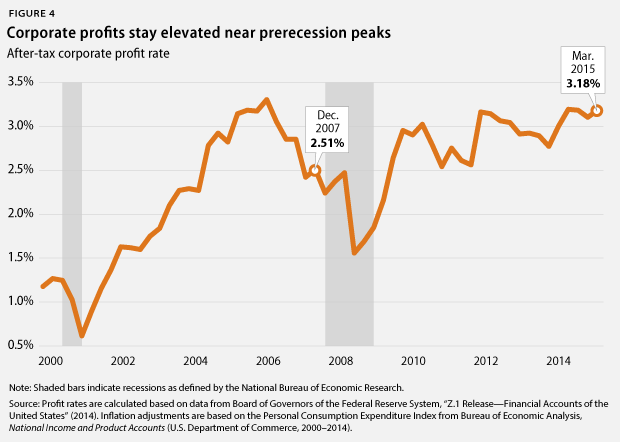
9. Corporate profits stay elevated near pre-crisis peaks. Inflation-adjusted corporate profits were 119.2 percent larger in March 2015 than in June 2009. The after-tax corporate profit rate—profits to total assets—stood at 3.18 percent in March 2015. Corporate profits recovered quickly toward the end of the Great Recession and have stayed high since then. These gains have translated into disproportionate income gains from financial investments for wealthy households, contributing to the massive income inequality that has characterized the economy for the past few decades. Tax reform is a crucial policy priority to address income inequality that arises from the rich receiving outsized benefits from their wealth, especially in the form of capital income from their financial investments.
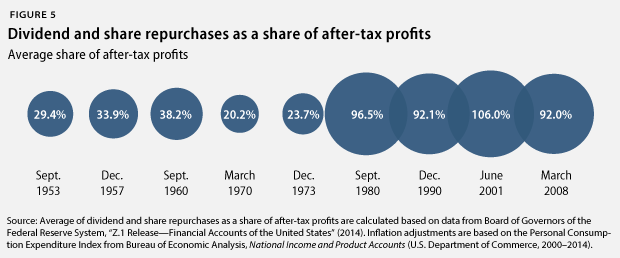
10. Corporations spend much of their money to keep shareholders happy. From December 2007—when the Great Recession started—to March 2015, nonfinancial corporations spent, on average, 92 percent of their after-tax profits on dividend payouts and share repurchases. In short, almost all of nonfinancial corporate after-tax profits have gone to keeping shareholders happy during the current business cycle. Nonfinancial corporations also held, on average, 5.3 percent of all of their assets in cash. Nonfinancial corporations spent, on average, 163.3 percent of their after-tax profits on capital expenditures or investments—by selling other assets and by borrowing. This was the lowest ratio since the business cycle that ended in 1957. U.S. corporations have prioritized keeping shareholders happy and building up cash over investments in structures and equipment, highlighting the need for regulatory reform that incentivizes corporations to invest in research and development, manufacturing plants and equipment, and workforce development.
11. Poverty is still widespread. The poverty rate was 14.5 percent in 2013, down from 15 percent in 2012. This change, however, was statistically insignificant. Moreover, the poverty rate for this recovery increased at a rate of 0.2 percentage points, compared to an average decrease of 0.7 percentage points in previous recoveries of at least equal length. Some population groups suffer from much higher poverty rates than others. The African American poverty rate, for instance, was 27.2 percent, and the Hispanic poverty rate was 23.5 percent, while the white poverty rate was 9.6 percent. The poverty rate for children under age 18 fell to 19.9 percent. More than one-third of African American children—37.7 percent—lived in poverty in 2013, compared with 30.4 percent of Hispanic children and 10.7 percent of white children.
12. Household debt is still high. Household debt equaled 102 percent of after-tax income in March 2015, down from a peak of 129.7 percent in December 2007. But nonrevolving consumer credit—typically installment credit such as student and car loans—has outpaced after-tax income growth. It has grown from 14.5 percent of after-tax income in June 2009 to 18.4 percent in March 2015. This is the highest share of such debt to after-tax income on record, dating back to 1968. A return to debt growth outpacing income growth—which was the case for total debt prior to the start of the Great Recession—from already-high debt levels could eventually slow economic growth again. This would be especially true if interest rates also rise from historically low levels due to a change in the Federal Reserve’s policies. Consumers would have to pay more for their debt, and they would have less money available for consumption and saving, slowing economic growth and job creation.
Christian E. Weller is a Senior Fellow at the Center for American Progress and a professor in the Department of Public Policy and Public Affairs at the McCormack Graduate School of Policy and Global Studies at the University of Massachusetts, Boston. Jackie Odum is a Research Assistant for the Economic Policy team at the Center.