To see an updated version of this report, covering all 50 states, please click here.
This report contains a correction.
Introduction and summary
For working parents with young children, the task of finding child care can be daunting. Across the country, parents report frustration when trying to find affordable, high-quality child care. While the cost of child care is certainly a barrier to child care access, less understood are the roles of supply and location. This report examines the location of child care centers across eight states, comprising 20 percent of the U.S. population younger than the age of 5, and uncovers another cause driving the child care crisis: 42 percent of children under 5 years of age live in child care deserts.
The term “child care desert” is not currently part of the American lexicon. However, lack of child care supply is a serious national problem that disproportionately impacts rural areas. The Center for American Progress is introducing a working definition of child care deserts, which borrows its terminology from the frequently studied problem of food deserts—what the government defines as communities in which residents do not live in close proximity to affordable and healthy food retailers.1 For the purposes of this study, a child care desert is defined as a ZIP code with at least 30 children under the age of 5 and either no child care centers or so few centers that there are more than three times as many children under age 5 as there are spaces in centers. (see Figure 1)

In order to assess how location might affect a family’s child care options, this report explores the geographic characteristics of center-based early care and education programs, including child care centers, Head Start, and public and private preschool programs. This study uses state administrative data and ZIP code-level census estimates to analyze differences in the presence and cumulative capacity of child care centers across eight states: Colorado, Georgia, Illinois, Maryland, Minnesota, North Carolina, Ohio, and Virginia.2 This subset of states results from the fact that while the authors requested data from most states, many agencies did not respond or chose not to share administrative data.3 However, these eight states are generally illustrative of the state of child care across the country. See Appendix B for more detail.
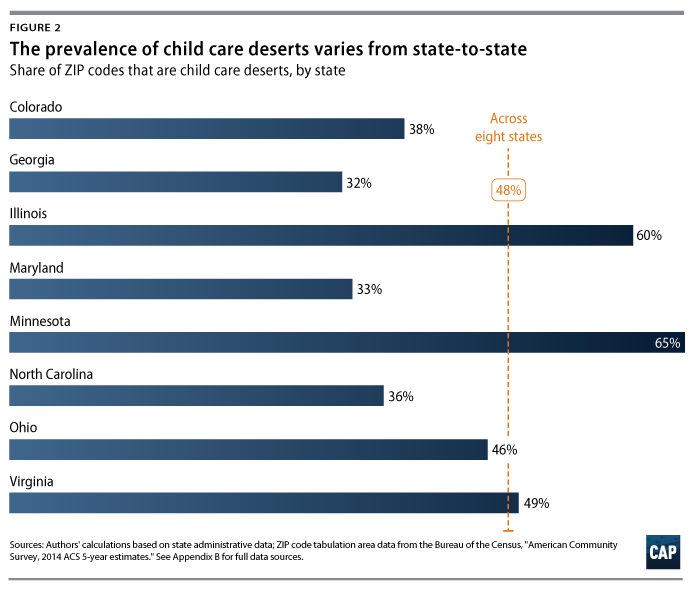
When the working definition of a child care desert is applied to the data gathered from these eight states, the scope of the child care crisis comes into focus: 48 percent of the nearly 7,000 ZIP codes in these states are child care deserts. In some states, a substantial majority of the population lives in child care deserts, with nearly two-thirds of Minnesota ZIP codes and 60 percent of Illinois ZIP codes fitting the definition.4 Across the eight states, more than 27 million people live in child care deserts, including 1.8 million children under the age of 5.5
The vast majority of American families need high-quality child care and early education programs to support the development of young children, as well as the economic well-being of families. Yet high-quality child care is out of reach for many families, as child care is increasingly consuming more of the family budget. At nearly $18,000 per year, the average cost of center-based care for an infant and a preschooler amounts to 29 percent of the median family income.6 Analysis by the U.S. Bureau of the Census shows that the average weekly cost of child care for families with employed mothers is about 30 percent higher than it was 15 years ago.7
While the cost of child care is well-documented, affordability is only one factor that contributes to access to high-quality child care. For many parents, especially low-income parents, location is a major consideration in choosing child care and a limiting factor for many families.8 Recent economic research has found that children are more likely to attend centers close to home when such centers are available.9 Of course, geographic proximity to a child care center does not always mean that families are able to enroll. Factors such as cost, child care subsidies, work schedules, waiting lists, and many others impact access to child care. However, location is an important consideration for many families, and more information about families’ proximity to child care programs can inform efforts to increase access to high-quality early childhood programs.
The results of this study show that a majority of rural ZIP codes are child care deserts, meaning that 55 percent of children under the age of 5 in rural areas live in child care deserts. In terms of total population, there are many more children under age 5 living in suburban child care deserts: Nearly 1 million young children in suburban areas across the eight states live in child care deserts. By and large, about one-third of urban neighborhoods are child care deserts, with one major exception. This study finds that in Chicago, 5 out of 6 children under the age of 5 live in child care deserts—more than 150,000 children—which is nearly half of the urban child care desert population across all eight states.10
Child care deserts differ from areas with greater child care supply in several interesting ways. While child care deserts have roughly the same rates of poverty as nondeserts, the labor force participation rate for mothers with children under the age of 6 is about 1.1 percentage points lower in child care deserts. Child care desert communities tend to have higher proportions of Hispanic residents and lower proportions of African American residents. As one might expect, child care deserts average only 1.5 child care centers, whereas other ZIP codes comprise an average of 4.9 centers.11
This study also examines the presence of center-based programs rated by a state’s quality rating and improvement system, or QRIS. While many systems are still under development, the data show that fewer than half of all centers participated in their state’s QRIS, and only about 16 percent of all centers across the eight states were in the top tiers of quality.12
Together, these findings show the child care marketplace in a state of crisis. In many parts of this country, working families face a deep shortage of child care options, which are often of inconsistent quality and at a financial cost that is out of reach. The Center for American Progress has proposed a High-Quality Child Care Tax Credit that would make high-quality care much more affordable for low-income and middle-class families. However, the ubiquity of these child care deserts means that it is crucial that the nation also invests substantially greater public resources in child care infrastructure and supply.
Background
Over the past few decades, the dramatic increase in maternal labor force participation and dual-earner families has radically changed where and with whom young children spend much of their time. In 1970, 30 percent of mothers with a child under age 6 were employed; this number had grown to 64 percent by 2015.13 At the same time, the use of nonparental child care has become the norm. In 2011, more than 60 percent of children under age 5 regularly attended one or more nonparental child care arrangements. One-quarter of children under the age of 5 with employed mothers regularly attended center-based early childhood programs—including child care centers, preschools, and Head Start—while other children were cared for in their homes or caregivers’ homes by relatives, by neighbors, or in family child care.14
The first years of life are a critical period for child development. As research across neuroscience, developmental psychology, and economics demonstrates, early social-emotional, physical, and cognitive skills beget later skill acquisition, setting the groundwork for success in school and the workplace.15 However, an analysis of nationally representative data shows that 65 percent of child care centers do not serve children age 1 or younger and that 44 percent do not serve children under age 3 at all.16 Consequently, child care centers only have the capacity to serve 10 percent of all children under age 1 and 25 percent of all children under age 3.17 High-quality child care during this critical period can support children’s physical, cognitive, and social-emotional development.18 Attending a high-quality early childhood program such as preschool or Head Start is particularly important for children in poverty or from other disadvantaged backgrounds and can help reduce the large income-based disparities in achievement and development.19
In 2014, 65 percent of children under age 6 in the United States lived in families in which all parents were in the labor force, requiring high-quality, accessible, and affordable child care to support both these children’s development and their parents’ employment.20 Child care, however—particularly high-quality center care—is expensive and hard to find. In 2014, the average cost of full-time infant care ranged from $4,822 to $17,062 per year—between 7 percent and 15 percent of median income for a married-couple household and between 24 percent and 63 percent of median income for a single-mother household.21 The cost of center-based child care for 4-year-olds is also sizeable—between $3,972 and $10,030 per year.22
In recent years, researchers have examined the variety of factors that influence how families make child care choices. While some aspects of child care decisions can be attributed to characteristics of the parent or child, studies have found that families often face multiple constraints such as location, work schedules, and a lack of information.23 Low-wage workers in particular regularly cope with shifting schedules and nontraditional hours.24 This points to one of the obvious challenges for low-income families: the scarcity of child care centers with nontraditional hours.
All families need developmentally supportive child care in the communities in which they live and work. But according to a recent study from the U.S. Department of Health and Human Services, higher-income areas are geographically associated with a higher availability of center-based child care, especially in the case of infant and toddler care.25 For struggling communities, a local shortage of quality center-based care can aggravate the difficulties that low-income working families already endure.
Recent technological advancements have resulted in the development of innovative location-based techniques for economic analysis. Using precise geo-referenced data, new research has shown a significant relationship between distance from child care and attendance.26 Employing similar methods, economists have discovered that proximity to child care options contributes to women’s participation in the workforce.27 But geographic availability, on its own, does not equal access. A number of issues play a role in determining access to child care, including cost, work schedules, cultural or linguistic factors, and availability of slots. While this report is primarily concerned with the geographic availability of child care centers, the broader question of access requires nuanced further study.
Even if parents do have access to child care, high-quality programs are out of reach for many families. The most recent available data show that only 13 percent of 2-year-olds attending child care were in settings rated as high quality.28 Prior research has found that high-poverty communities and rural areas lack access to center care and that children from low-income families are less likely to attend high-quality child care.29 Low-income children are also less likely to attend child care centers, as compared with other types of nonparental care.30 While there is considerable variability in quality within each type of care, centers tend to average higher quality ratings, and center care attendance is associated with improved cognitive and language outcomes when compared with exclusive parental or home-based care.31 While home-based child care is a critical part of the early childhood landscape, families need a range of child care options, and since child care centers tend to offer higher-quality care, they are a major part of the supply equation and should be available to families that want or need this type of care.
Methodology
For this report, the authors collected data on the locations and capacities of all licensed child care centers in eight states. This subset of states results from the fact that while data was requested from most states, many agencies did not respond or chose not to share administrative data.32 The eight states that provided complete data are generally illustrative of the state of child care across the country. They include large rural and urban populations, and they exhibit geographic and demographic diversity. These relatively populous states contain one-fifth of the U.S. population under the age of 5.33
The administrative data on child care center locations included a ZIP code for each center. Using U.S. Census Bureau data, the authors were able to match the child care center locations with census estimates of each ZIP code’s demographic, geographic, and economic characteristics. This merged data set was used to compare and analyze the prevalence of child care deserts among ZIP codes of differing types: rural, suburban, and urban; low, moderate, and high poverty; and those of varying racial and ethnic demographic profiles. For more information on the authors’ methodology, see Appendix B.
Nearly half of ZIP codes are child care deserts
This study examined the presence, capacity, and quality ratings of child care centers across eight states: Colorado, Georgia, Illinois, Maryland, Minnesota, North Carolina, Ohio, and Virginia. Forty-eight percent of the ZIP codes across the eight states are child care deserts. As shown in Figure 2, the proportion of ZIP codes that qualify as child care deserts varies by state, from 32 percent in Georgia to 65 percent in Minnesota.34
In total, there were 22,928 child care centers in the eight states’ administrative databases.35 However, these states have more than 4.3 million children under the age of 5, meaning that there is a deep undersupply of child care centers, particularly those in the top tiers of quality.36 Only 16 percent of the child care centers in these eight states were in the top tier of quality, with a majority of those centers located in North Carolina. Outside of North Carolina—one of the earliest states to develop and implement a quality rating and improvement system—only 8 percent of centers were in the top tiers of their state’s quality rating system.37
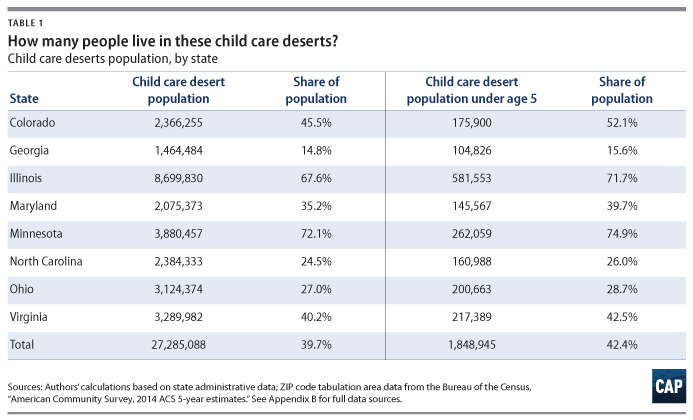
In just these eight states, more than 27 million people live in child care deserts. Table 1 reports estimates of the total population and the population under age 5 in each state’s child care deserts. Remarkably, nearly half of all the young children living in child care deserts are located in just two states: Illinois and Minnesota.38 However, even in the states that have the fewest child care deserts, about 1 in 4 residents lives in an undersupplied child care market. Findings for each state are presented in detail in Appendix A.
What is in a ZIP code?
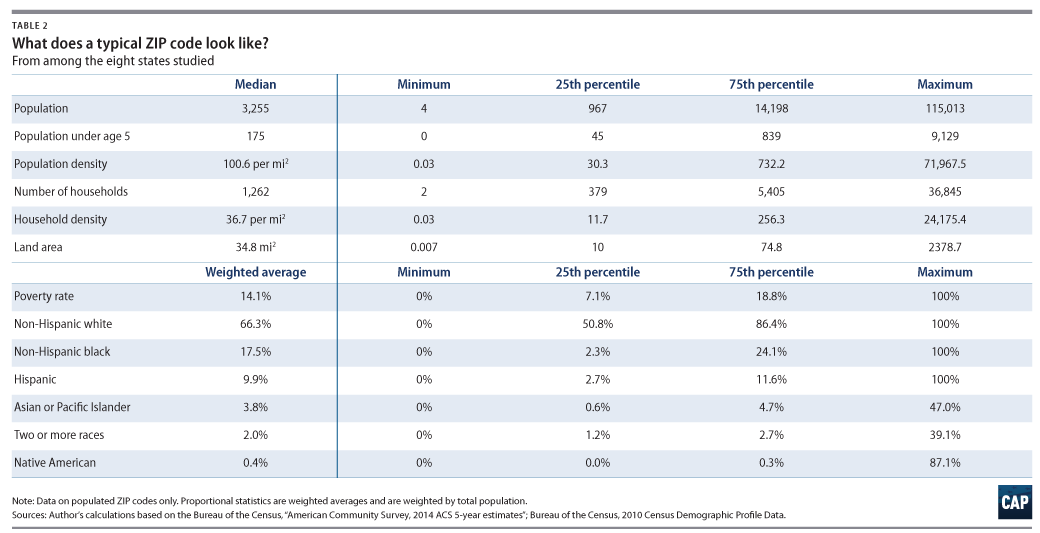
ZIP codes vary enormously by population, land area, density, demographics, and poverty. Since ZIP codes are a somewhat unfamiliar geographic unit, Table 2 presents summary statistics for the typical ZIP code from these eight states. Among the states in this study, the median population of a ZIP code is about 3,250 residents, with 175 being under the age of 5. The median size of these ZIP codes is 35 square miles, which is about 1 ½ times the size of Manhattan. However, some urban ZIP codes consist of only a few city blocks, and certain rural ZIP codes in Colorado cover more than 1,000 square miles, which is roughly the size of Rhode Island. In total, about 65 percent of all ZIP codes are rural, with 29 percent being suburban and 6 percent being urban.
A look at child care deserts across three dimensions
This report analyzes differences in the prevalence of child care deserts across three dimensions: geographic, economic, and demographic. The geographic analysis is based on ZIP codes that are assigned as rural, suburban, or urban. The economic analysis uses census-estimated ZIP code poverty rates to categorize each community as displaying low, moderate, or high poverty. The demographic analysis uses racial and ethnic demographics at the ZIP code level to determine disparate proximity to child care centers based on race and ethnicity. These divisions serve to demonstrate the local characteristics that are often correlated with insufficient child care capacity.
Geographic analysis: Deserts by rural, suburban, and urban ZIP codes
Rural ZIP codes
The most severe shortage of child care centers is in America’s rural communities. Rural areas are more likely to be child care deserts than not, with 54 percent of rural ZIP codes qualifying under the definition. About two-thirds of rural child care deserts have no child care centers at all, despite that fact that the median rural ZIP code is home to about 100 young children. In fact, rural child care deserts average about the same number of children under the age of 5 as nondeserts. Thus, population size does not appear to explain the lack of centers in rural child care deserts. The proportion of rural ZIP codes that qualify as child care deserts varies by state, with Illinois, Ohio, and Minnesota having the highest rate of rural deserts, as seen in Figure 3.
About 3 out of 4 child care deserts are rural, but there are many more rural ZIP codes overall than suburban and urban ZIP codes. The median rural ZIP code is home to about 2,000 people—about 100 of them children under the age of 5—with zero child care centers. By contrast, the median number of centers in a suburban ZIP code is five, while the median number in an urban ZIP code is eight. Table 3 reports summary statistics for the median rural, suburban, and urban ZIP code.
Suburban ZIP codes
The majority of Americans live in suburban ZIP codes. While rural areas are more likely to meet the definition of child care deserts, the majority of the young children in this study are found in suburban ZIP codes. The authors designate ZIP codes as suburban based on the density of housing, meaning that some low-density areas of large cities are viewed as suburban. Although only 36 percent of suburban children under the age of 5 live in child care deserts, that totals nearly 1 million suburban children. Figure 4 shows both the share of children under age 5 in deserts, as well as the total number of children in each type of ZIP code. For more information on the methodology used to assign ZIP codes as suburban, urban, or rural, see Appendix B.
Urban ZIP codes
Densely populated urban communities are less likely to face child care shortages, but urban child care deserts remain a serious problem. There are only 157 urban ZIP codes that qualify as child care deserts under the working definition, but these ZIP codes are home to nearly 5 million residents, including about 375,000 children under the age of 5. By far, Chicago has the most severe urban child care desert problem, with 84 percent of young children living in a child care desert—totaling more than 150,000 children under the age of 5. The cities of Chicago, Denver, and Minneapolis-St. Paul are home to nearly 90 percent of the urban child care desert population across the eight states.
Urban child care deserts have, on average, about 1,000 more children under 5 years of age than urban nondeserts. This means that urban neighborhoods with the highest child populations have an ongoing undersupply of child care center spaces. These areas also tend to have much higher proportions of Hispanic families than urban nondeserts, which is examined in more depth in the demographic analysis section.
Urban child care deserts have, on average, about 1,000 more children under age 5 than urban nondeserts.
Economic analysis: Deserts by local poverty rate
The local poverty rate turns out to be a poor predictor of child care deserts. Most child care deserts are in areas with low or moderate poverty rates, using the official poverty threshold from the U.S. Census Bureau. In this analysis, a ZIP code’s poverty rate determined whether it was categorized as low, moderate, high, or extreme poverty, as seen in Figure 6. Notably, areas with moderate poverty—defined as areas in which 10 percent to 20 percent of residents are in poverty—showed the highest likelihood of being a child care desert. Averaged together, these eight states reflect the national poverty rate, which has hovered just below 15 percent. The child poverty rate is consistently higher, most recently reported to be 21 percent.39
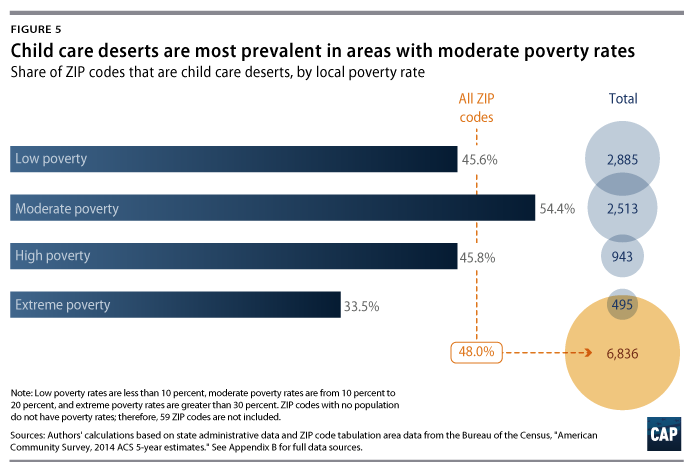
Somewhat surprisingly, ZIP codes with the highest poverty rates were much less likely to be child care deserts. Furthermore, among those deserts with extreme poverty, more than half were in rural ZIP codes. This reduced incidence of child care deserts in areas of concentrated poverty is likely the result of targeted public early care and education programs such as state public preschool, Head Start, and Early Head Start. Without a continued public commitment to providing educational support for families and children in urban poverty, these communities would likely not be served by the private child care market. Conversely, some rural communities experiencing high rates of poverty seem to be underserved by public programs. While Head Start provides grants to child care providers in all areas, rural municipalities may often lack the resources to fund public preschool or infant and toddler care.
Demographic analysis: Deserts by racial and ethnic population
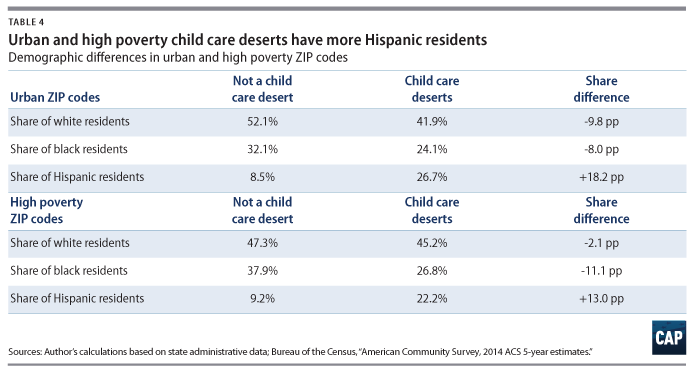
By analyzing the racial and ethnic demographics of each ZIP code, this report seeks to identify which subpopulations are affected more than others. The demographic profiles of child care deserts indicate that child care deserts tend to have much higher representation of Hispanic populations. Meanwhile, they also tend to have significantly lower representation of non-Hispanic black residents—13.5 percent in child care deserts and 20.2 percent in nondeserts.
These differences are even more apparent when broken down by urbanicity and poverty, as shown in Table 4. Among just the urban ZIP codes in these states, child care deserts have three times the percentage of Hispanic residents as nondesert areas. In these same urban areas, the percentage of non-Hispanic white and black residents is much lower in child care deserts. The same trend is evident in child care deserts with poverty rates above 20 percent. Regardless of urbanicity, high-poverty child care deserts seem to be much more prevalent in Hispanic communities than non-Hispanic white or black communities.
Even when controlling for differences in urbanicity, poverty rate, population density, and state, an increase in the percentage of Hispanic residents is associated with a large and significant increase in the likelihood that a ZIP code will be a child care desert. In keeping with these findings, Figure 6 shows that more than half of the Hispanic population across these eight states lives in child care deserts.
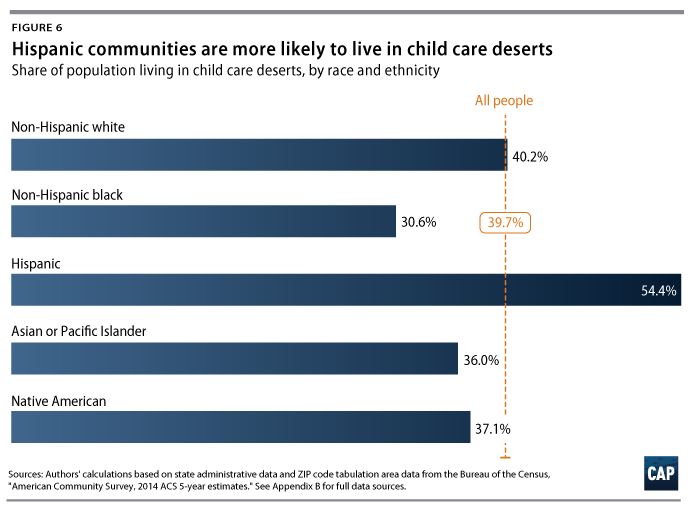
There are numerous ways to interpret these findings, and more detailed research will be necessary to inform the child care choices that Hispanic families make. In recent years, some researchers have observed that Hispanic families demonstrate a preference for informal or relative care over center-based child care.40 However, the results of this analysis call into question the directionality of this association. In other words, it could be possible that Hispanic communities tend to have fewer child care centers in their neighborhoods, and thus the choice architecture is structured to favor home-based care. The precise relationship between race and child care availability may be impossible to model, but this research calls into question whether long-held assumptions of cultural preference have inadvertently reduced the supply of child care centers in predominantly Hispanic communities.
Child care centers that are rated as high quality remain scarce
State administrative data also contained quality ratings for centers that participated in their quality rating and improvement systems. Some of the states have revised or expanded their QRIS systems since the time that this data was recorded, meaning that the analysis of these ratings is reflective of the quality ratings environment in 2014–2015. The authors designated which ZIP codes contained any centers rated in the top tiers of the QRIS, finding that 61 percent of ZIP codes with at least one center did not have a center rated as high-quality. Even after controlling for the fact that some nondeserts do not contain any centers, child care deserts are still significantly more likely to lack high-quality-rated child care centers: 66 percent of child care deserts with at least one center did not have a center rated as high-quality.
Only 44 percent of the nearly 23,000 child care centers in these states participated in their state QRIS, despite the fact that two states, Colorado and North Carolina, required all licensed centers to be rated. For the other six states in this study, only 13 percent of centers participated in their state’s quality rating system. Outside of North Carolina, only 8 percent received a high-quality rating. Since North Carolina’s QRIS has been in place for nearly 20 years, this disparity in quality ratings may reflect the fact that many other states were and are still cultivating QRIS participation.
Finally, this study analyzed the relationship between individual centers’ QRIS scores and the urbanicity and poverty rates of those centers’ ZIP codes. The analysis found that urban areas and areas with higher poverty tended to have higher QRIS ratings, even after controlling for poverty, state rating system, urbanicity, and child care desert status.
Policy recommendations and conclusion
As this report shows, most areas lack high-quality child care options, and many areas do not have enough child care center spaces. The presence of these child care deserts shows that beyond the cost issue, the United States faces a mounting crisis of child care availability. This lack of supply and proximity cannot be corrected without an infrastructure investment in communities that have been revealed to be child care deserts. Just as policymakers recognize the need for long-overdue infrastructure investment in our roads, bridges, and public buildings, they must allocate public resources toward improving the infrastructure necessary for high-quality child care and early childhood education. The next administration, working with Congress, should make a major infrastructure investment in child care to address this critical need for American workers.
In addition, the United States needs comprehensive child care reform to build the supply of high-quality options and make child care more affordable for families. The Center for American Progress has proposed a High-Quality Child Care Tax Credit to help low-income and middle-class families afford quality child care. For parents earning the median family income, center-based child care for two children can rival housing costs or even exceed the cost of college tuition in some states.41 The proposed tax credit would be targeted to high-quality providers, driving the child care market to improve and creating a choice among quality child care providers.42
The tax credit would provide up to $14,000 per child per year, paid directly to providers on a monthly basis, which would help low- and middle-income families meet the expense of high-quality child care. Depending on the average child care costs in the state where a family lives, a family earning $40,000 per year would see an annual savings of approximately $2,000 to $19,000 per year.43 This proposal would also keep in place the approximately $5 billion in federal child care funds that go to states in order to help them build the supply of high-quality child care and erase child care deserts, among other aims.
Appendix A: State-by-state findings
Colorado
Colorado has a lower proportion of child care deserts than many of the states in this study, but these child care deserts are heavily populated: Only 38 percent of Colorado ZIP codes are classified as child care deserts, but they contain 46 percent of the state’s residents. About half of the Coloradans living in child care deserts are in the greater Denver area.44 Colorado child care deserts have a significantly higher proportion of residents who are people of color: While ZIP codes that have sufficient child care supply are 76 percent white, child care deserts are only 61 percent white. Three in five Hispanic Coloradans live in a child care desert, which makes them 50 percent more likely to live in a child care desert than non-Hispanic white Coloradans.
Colorado child care desert facts:
- 2,366,255 Coloradans live in child care deserts, which is 46 percent of the population.
- About half of the Denver-Aurora-Lakewood metropolitan ZIP codes are child care deserts, which are home to more than 1.1 million people.45
- There are 175,900 children under the age of 5 in Colorado child care deserts, more than half of whom live in the Denver metro area.
- Colorado has the highest proportion of Hispanic residents of all eight states in the study.
- Colorado has the lowest proportion of non-Hispanic black residents of all eight states in the study.
- Only 40 percent of white Coloradans live in child care deserts, while more than 60 percent of black and Hispanic Coloradans live in child care deserts.
- In terms of land area, Colorado has the largest ZIP codes in the study.
- Colorado had only 11,334 federally funded Head Start slots in 2014—the second fewest of the eight states studied.
- On average, there are 3.9 child care centers per ZIP code in Colorado. The median ZIP code has one child care center.
- About 60 percent of Coloradans live in suburban ZIP codes, nearly half of which are child care deserts.
- Only 36 percent of rural ZIP codes are child care deserts, a smaller proportion than in all but one other state in the study.
- Fewer than 1 in 5 Colorado child care centers received a high-quality rating under Colorado’s quality rating and improvement system.
- In 2015, full-time infant care at a Colorado child care center averaged $14,950 per year—16 percent of the state median income for a married couple with children.46
- In 2015, preschool for a 4-year-old in Colorado averaged $11,089 per year—12 percent of the state median income for a married couple with children.47
Georgia
About one-third of Georgia ZIP codes are child care deserts, which is the lowest rate of all eight states studied. Since Georgia child care deserts are more likely to be in rural areas, the state has the lowest proportion of its residents living in child care deserts—fewer than 15 percent. Nonetheless, more than 800,000 Georgians reside in rural child care deserts, and nearly half of them are in areas where the poverty rate is higher than 20 percent.48 The federal government funds nearly 25,000 Head Start slots in Georgia, but with the state’s high poverty rate and a population of 650,000 children under age 5, demand greatly exceeds supply.
Georgia child care desert facts
- 1,464,484 Georgians live in child care deserts, which is 15 percent of the population.*
- There are 104,826 children under the age of 5 in Georgia child care deserts, half of whom live in rural ZIP codes.
- 41 percent of the rural ZIP codes in Georgia are child care deserts. Only 13 percent of nonrural ZIP codes are child care deserts.
- About one-quarter of the young children in Georgia’s child care deserts live in high-poverty rural areas.49
- Georgia has the highest proportion of non-Hispanic black residents of all eight states in the study.
- Only 12 percent of non-Hispanic black Georgians live in child care deserts, while more than 16 percent of both white and Hispanic Georgians live in child care deserts.
- Georgia had 24,656 federally funded Head Start slots in 2014.
- On average, there are 5.5 child care centers per ZIP code in Georgia—the highest rate in the study. The median Georgia ZIP code has two child care centers.
- About 63 percent of Georgians live in suburban ZIP codes.
- Fewer than 8 percent of Georgia child care centers participated in the state’s QRIS.
- Only 2 percent of Georgia child care centers received a high-quality rating under Georgia’s QRIS.
- In 2015, full-time infant care at a Georgia child care center averaged $10,557 per year—13 percent of the state median income for a married couple with children.50
- In 2015, preschool for a 4-year-old in Georgia averaged $8,625 per year—11 percent of the state median income for a married couple with children.51
Illinois
In Illinois, more than 8 million people live in child care deserts. Whether in rural, suburban, or urban parts of the state, a majority of its ZIP codes are child care deserts. Chicago is the largest urban child care desert in all eight states, where 5 out of 6 children under the age of 5 live in a child care desert. Overall, 80 percent of Chicagoans live in a child care desert. Hispanic families are significantly more likely to live in an Illinois child care desert than non-Hispanic white or black families: More than 86 percent of Hispanic residents of Illinois live in child care deserts.
Illinois child care desert facts
- 8,699,830 Illinoisans reside in child care deserts, which is 68 percent of the population.
- Approximately 80 percent of Chicagoans live in a child care desert, which amounts to more than 2.1 million people.
- There are 581,553 children under the age of 5 in Illinois child care deserts.
- About one-quarter of those kids—more than 150,000 children—live in the city of Chicago.
- Illinois has the second-highest proportion of Hispanic residents of the eight states in the study.
- About 60 percent of non-Hispanic white and black Illinoisans live in child care deserts, while more than 85 percent of Hispanic Illinoisans live in child care deserts.
- About 1.8 million Hispanic Illinoisans live in child care deserts, which is approximately half of the entire Hispanic child care desert population across the eight states.
- Illinois had 42,170 federally funded Head Start slots in 2014, the most of the eight states studied. About 20,000 of those slots were in Chicago.
- On average, there are two child care centers per ZIP code in Illinois. The median ZIP code has zero child care centers.
- About 54 percent of Illinoisans live in suburban ZIP codes, more than half of which are child care deserts.
- 62 percent of urban ZIP codes in Illinois are child care deserts—the highest proportion of urban deserts in the study.
- Fewer than 1 in 6 Illinois child care centers received a high-quality rating under Illinois’ QRIS.
- In 2015, full-time infant care at an Illinois child care center averaged $14,829 per year—16 percent of the state median income for a married couple with children.52
- In 2015, preschool for a 4-year-old in Illinois averaged $11,112 per year—12 percent of the state median income for a married couple with children.53
Maryland
Maryland has the second-lowest rate of child care deserts in the study, although that still means that one-third of Maryland ZIP codes are child care deserts. Maryland is the most densely populated state in the study, and most Marylanders live in somewhat densely populated suburbs. Among Maryland’s urban ZIP codes, more than half of the population lives in a child care desert. As shown in Figure 10, there is a clear racial disparity in the proportion of Marylanders living in child care deserts. Non-Hispanic white residents are much less likely to live in a child care desert than black or Hispanic residents. Maryland also has the highest average cost of infant child care and preschool among the eight states in the study.
Maryland child care desert facts
- 2,075,373 Marylanders reside in child care deserts, which is 35 percent of the population.
- About half of Maryland’s urban ZIP codes are child care deserts—home to more than 500,000 people, including 225,000 residents of Baltimore.
- There are 145,567 children under the age of 5 in Maryland child care deserts.
- Maryland has the lowest poverty rate of all eight states in the study.
- Maryland has the second-highest proportion of non-Hispanic black residents of all eight states in the study.
- Only 31 percent of non-Hispanic white Marylanders live in child care deserts, while more than 40 percent of black Marylanders and 51 percent of Hispanic Marylanders live in child care deserts.
- Maryland is the most densely populated state in the study.
- Maryland only had 10,102 federally funded Head Start slots in 2014, the fewest of the eight states studied.
- On average, there are 4.8 child care centers per ZIP code in Maryland. The median ZIP code has two child care centers.
- About 71 percent of Marylanders live in suburban ZIP codes, making Maryland the most suburban state in the study.
- Only 33 percent of rural ZIP codes are child care deserts, the second lowest proportion across all eight states.
- Less than 4 percent of Maryland child care centers received a high-quality rating under Maryland’s QRIS.
- In 2015, full-time infant care at a Maryland child care center averaged $18,597 per year—16 percent of the state median income for a married couple with children.54
- In 2015, preschool for a 4-year-old in Maryland averaged $12,608 per year—11 percent of the state median income for a married couple with children.55
Minnesota
Minnesota has the highest rate of child care deserts and the highest proportion of its population living in child care deserts. As of July 2016, there are only 1,253 child care centers in Minnesota, with the capacity to serve 81,306 children. With about 350,000 children under the age of 5 in Minnesota, that means that there are more than four children for every child care center slot. Additionally, the Twin Cities metro region is one of the largest urban child care deserts in the study. About two-thirds of the Minneapolis-St. Paul population live in a child care desert, which amounts to 1.2 million people. Finally, Minnesota is the most rural state in this study, and in Minnesota’s rural areas, child care supply is even lower: 84 percent of rural Minnesotans live in a child care desert.
Minnesota child care desert facts
- 3,880,457 Minnesotans live in child care deserts, which is 72 percent of the population.
- About two-thirds of Minneapolis-St. Paul ZIP Codes are child care deserts—containing more than 1.2 million people.56
- In Minneapolis-St. Paul, more than 70 percent of children under age 5 reside in a child care desert.
- There are 262,059 children under the age of 5 in Minnesota’s child care deserts, which is 75 percent of the population under 5 years old.
- Minnesota is the most rural state in the study, and 84 percent of rural Minnesotans live in child care deserts.
- Minnesota has the highest proportion of non-Hispanic white residents of all eight states in the study.
- When broken down by race and ethnicity, there is almost no difference in the proportions of white, black, and Hispanic populations living in child care deserts.
- In terms of land area, Minnesota has the second-largest ZIP codes in the study after Colorado.
- Minnesota only had 12,486 federally funded Head Start slots in 2014, third fewest of the eight states.
- On average, there are only 1.4 child care centers per ZIP code in Minnesota, the fewest in the study. The median ZIP code has zero child care centers.
- About 1 in 8 Minnesota child care centers received a high-quality rating under Minnesota’s QRIS.
- In 2015, full-time infant care at a Minnesota child care center averaged $17,442 per year—17 percent of the state median income for a married couple with children.57
- In 2015, preschool for a 4-year-old in Minnesota averaged $13,174 per year—13 percent of the state median income for a married couple with children.58
North Carolina
North Carolina has the most child care centers per ZIP code of all eight states. Nonetheless, more than one-quarter of North Carolinians under the age of 5 live in child care deserts. Like the other states in this study, the supply of child care center slots is substantially lower in rural areas. The state was one of the first to implement a QRIS, and all licensed child care centers are currently required to participate in the QRIS. Relative to the state median income, the average North Carolina child care center is less expensive than the other states in this study.
North Carolina child care desert facts
- 2,384,333 North Carolinians live in child care deserts, which is 24 percent of the population.
- About 1 million North Carolinians live in rural child care deserts, which is one-third of the state’s rural population.
- There are 160,988 children under the age of 5 in North Carolina’s child care deserts.
- About 40 percent of the young children in North Carolina child care deserts live in rural areas.
- North Carolina has 4,234 child care centers—more than all other states in the study.
- Less than 20 percent of non-Hispanic black North Carolinians live in child care deserts, while 26 percent of white and Hispanic North Carolinians live in child care deserts.
- North Carolina had 23,312 federally funded Head Start slots in 2014, which is 7 percent of the 320,000 total child care center slots in the state.
- On average, there are 5.2 child care centers per ZIP code in North Carolina. The median ZIP code has two child care centers.
- More than half of all North Carolinians live in suburban ZIP codes, of which only 28 percent are child care deserts.
- All licensed child care centers in North Carolina are included in the state’s QRIS.
- Nearly half of all child care centers received a high-quality rating under North Carolina’s QRIS.
- In 2015, full-time infant care at a North Carolina child care center averaged $9,254 per year—12 percent of the state median income for a married couple with children.59
- In 2015, preschool for a 4-year-old in North Carolina averaged $7,920 per year—10 percent of the state median income for a married couple with children.60
Ohio
Ohio child care deserts are a disproportionately rural phenomenon. While the majority of the state population resides in suburban communities, more than one-quarter of Ohioans live in rural ZIP codes. These communities are more likely to be child care deserts than not, with nearly 7 in 10 rural Ohio children living in child care deserts. In total, more than 100,000 rural Ohioans under age 5 live in the state’s rural child care deserts, making it the largest rural child care desert population of all eight states.
Ohio child care desert facts
- 3,124,374 Ohioans live in child care deserts, which is 27 percent of the population.
- More than 65 percent of Ohio’s rural ZIP codes are child care deserts, while less than 25 percent of its urban and suburban ZIP codes combined are child care deserts.
- More than two-thirds of Ohio’s children under the age of 5 in rural areas live in a child care desert.
- There are 200,663 children under the age of 5 in Ohio’s child care deserts, with more than half of them living in rural areas.
- About 1 in 4 Ohioans lives in a rural ZIP code, two-thirds of which are child care deserts.
- Ohio has the second-highest proportion of non-Hispanic white residents of the eight states in the study.
- Ohio has the lowest proportion of Hispanic residents of all eight states in the study.
- Only 12 percent of non-Hispanic black Ohioans live in child care deserts, while more than 25 percent of white and Hispanic Ohioans live in child care deserts.
- Ohio had 37,052 federally funded Head Start slots in 2014, second most of the eight states studied.
- On average, there are 3.5 child care centers per ZIP code in Ohio. The median ZIP code has one child care center.
- Less than 8 percent of Ohio’s 4,187 child care centers received a high-quality rating under Ohio’s QRIS.
- In 2015, full-time infant care at an Ohio child care center averaged $11,257 per year—13 percent of the state median income for a married couple with children.61
- In 2015, preschool for a 4-year-old in Ohio averaged $9,185 per year—10 percent of the state median income for a married couple with children.62
Virginia
With nearly 3.3 million people living in child care deserts, Virginia has one of the highest child care desert populations in the study. When compared with neighboring North Carolina, which has a larger population, Virginia has roughly 1 million more residents in child care deserts. While the majority of the state’s population is suburban, most ZIP codes in the state are rural, and they include the homes of more than 2 million Virginians. Just as in many other states, these communities have the highest likelihood of being child care deserts. As a result, two-thirds of Virginia’s children under the age of 5 in rural areas reside in a child care desert.
Virginia child care desert facts
- 3,289,982 Virginians live in child care deserts, which is 40 percent of the population.
- About two-thirds of Virginia’s rural ZIP codes qualify as child care deserts.
- There are 217,389 children under the age of 5 in Virginia’s child care deserts.
- Nearly two-thirds of Virginia’s children in rural areas live in child care deserts.
- About 60 percent of Virginians live in suburban ZIP codes, of which more than one-third are child care deserts.
- About 40 percent of non-Hispanic white and black Virginians live in child care deserts, while about 46 percent of Hispanic Virginians live in child care deserts.
- Virginia only had 14,181 federally funded Head Start slots in 2014, among the fewest of the eight states studied.
- On average, there are 2.4 child care centers per ZIP code in Virginia. The median ZIP code has zero child care centers.
- Virginia only has 2,151 child care centers, roughly half the number of centers in neighboring North Carolina.
- Less than 15 percent of Virginia child care centers participated in Virginia’s QRIS.
- Less than 5 percent of Virginia child care centers received a high-quality rating under Virginia’s QRIS.
- In 2015, full-time infant care at a Virginia child care center averaged $15,340 per year—15 percent of the state median income for a married couple with children.63
- In 2015, preschool for a 4-year-old in Virginia averaged $12,376 per year—12 percent of the state median income for a married couple with children.*64
Appendix B: Data and methodology
Methodology
The authors merged state administrative data on the locations and capacities of licensed child care centers and, when available, ratings from state quality rating and improvement systems with data from the U.S. Census Bureau’s American Community Survey, or ACS, 2010-2014 5-Year Estimates, downloaded using American FactFinder.65 The multiyear ACS data offer the advantage of increased statistical reliability for less populated areas and small population subgroups, and it is the only source for poverty rates at the ZIP code level.
Since ZIP codes are a geographic boundary designed for the efficient delivery of mail, they are an imperfect unit for statistical analysis. However, recognizing that they are a universally applied and readily available indicator of location, the U.S. Census Bureau has provided survey estimates at the ZIP code level since 2000. They do this by aggregating data from the census block level to create a ZIP code tabulation area, or ZCTA, which is a very close geographic approximation of the U.S. Postal Service’s ZIP code. The authors used a ZIP code-ZCTA crosswalk file to match the state child care center data to their corresponding ZCTAs for alignment with census estimates.66
For this research, which is not interested in the precise location of individual child care centers, the terms ZIP code and ZCTA are basically interchangeable. For the sake of readability, the authors use ZIP code throughout this report. Some ZIP codes, namely P.O. boxes and ZIP codes that are unique to a single building or campus, do not have a corresponding ZCTA. Some child care centers reported these non-ZCTA ZIP codes to their state licensing agencies, usually because they used a P.O. Box to receive mail. In these rare cases, the center was recoded to use the surrounding ZCTA in order to match it to census survey data.
Because ZIP codes are designed around the efficiency of mail delivery, urban ZIP codes are much larger, in terms of population, than suburban or rural ZIP codes. Densely populated urban areas with large apartment buildings are substantially easier to deliver mail to, meaning that urban post offices can service larger populations. Rural ZIP codes, by contrast, tend to be much larger in terms of land area.
The first step in analyzing the characteristics of child care deserts is deciding which ZIP codes are eligible to be considered child care deserts. In order to exclude from consideration areas with very small child populations, while still including most rural communities, the working definition institutes a minimum threshold of 30 children under the age of 5. Using this threshold, 25 percent of rural ZIP codes were excluded from consideration as child care deserts.
Similarly, in order to include for consideration areas with large populations but few child care centers, the definition uses a ratio of young children to child care capacity. Understanding that not all families will choose child care centers for their children, the authors set the desert threshold at a 3-1 ratio. This means that in child care deserts, if merely half of families chose to use center-based care, there would still not be enough cumulative spaces in all of the centers of that ZIP code. Using this threshold, all urban and suburban ZIP codes were included for consideration as child care deserts.
One of the goals of this research is to identify whether rural, suburban, or urban areas have different child care supply levels. Since, to a certain extent, these categories are a subjective evaluation, this question posed a formidable challenge. Inspired by research published by economist Jed Kolko, this study uses household density—that is, the number of occupied households per square mile—to categorize each ZIP code as rural, suburban, or urban.67 As the chief economist at a real estate search website, Kolko and his team conducted a national survey to develop a predictive model of the local characteristics associated with whether people say they live in an urban, suburban, or rural area. The research concluded that the strongest predictor of how people describe their ZIP codes’ urbanicity is the number of occupied housing units per square mile.68
Using the household density variable, each ZIP code was categorized as being rural, suburban, or urban. The results were analyzed visually by mapping the resulting dataset in ArcGIS for Desktop. This visual analysis confirmed that the urbanicity variable appropriately represented the rural, suburban, and urban characteristics of these eight states. Some cities, such as Chicago, are primarily urban, as they are densely populated. Other cities, such as Atlanta, are mostly coded as suburban ZIP codes, as they are more spread out and less densely populated. This matches Kolko’s research findings and reflects the general conception of Atlanta as one of the most sprawling American cities. One resulting strength of this analysis is that it treats the sprawling suburbs of Atlanta as having a fundamentally different residential character from the high-rise neighborhoods of Chicago.
This study also considers the state quality ratings for center-based programs. While each state has a quality rating and improvement system to assess the quality of early childhood programs, each system was in varying stages of development at the time the data was obtained. Some states had mature programs that included all child care and early education programs in the state, while others’ programs were recently implemented. Though the administrative data used for this study is recent—most commonly, 2014 state licensing data—some states have made updates or overhauls to their QRIS since that time. For this reason, the analysis of quality ratings and the prevalence of high-quality centers should be interpreted as a cross-section view of 2014 through 2015.
While a program’s quality rating is not a definitive measure of the quality of a child’s experience in a program, these ratings have important policy implications. States are increasingly tying tiered reimbursement rates to programs’ QRIS rating, such that programs with higher-quality ratings are eligible for higher reimbursements through the child care subsidy system. In many instances, programs can receive quality improvement supports—such as financial awards or bonuses, as well as technical assistance—by participating in the QRIS. A QRIS rating is certainly not the only marker of a quality program, but it is increasingly a meaningful distinction in the state’s early learning system and an important measurement.
Because some states’ data did not have capacity data for every child care center, the authors used a data imputation method to fill in missing data. This was done using the “mi set” command in Stata 14, which used a multiple regression over 20 runs to introduce stochastic error. In total, about 11 percent of the 22,928 centers were missing capacity data. The imputation regression used the following covariates to predict the capacity when values were missing: number of centers in ZIP code, state, population of ZIP code, population under the age of 5 in ZIP code, poverty rate in ZIP code, household density, and size of ZIP code in square miles.
The authors analyzed the presence and capacity of child care centers at the zip code level and, where available, their QRIS ratings. ZIP codes are the smallest level of geography for which the census releases public data on population, poverty, and other neighborhood characteristics. Although ZIP codes are a crude measure of neighborhoods—and many children attend child care located outside of their residential ZIP codes—research shows that many families reveal a preference to use care that is closer to home.69
Using this merged dataset, the authors produced state fact sheets and a cross-state report summarizing the findings across all eight states. Descriptive frequencies and medians are presented, and significant differences across ZIP codes with different poverty levels or racial demographic compositions were assessed using linear probability models for binary outcomes and linear regression for continuous outcomes. For all statements of statistical significance, a significance level of p < 0.05 was used, unless otherwise noted.
Data sources
Child care center administrative data
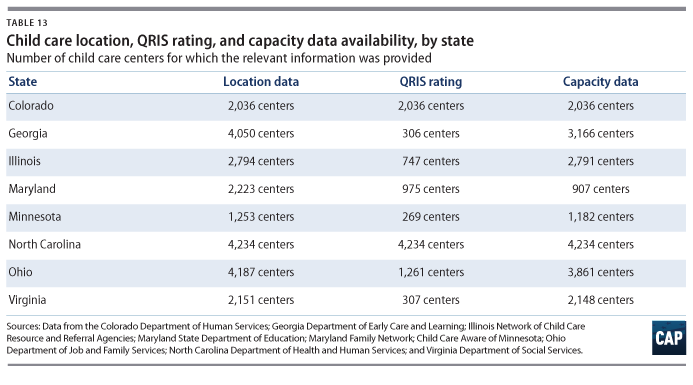
Child care center information was obtained from the following state agencies and organizations during the specified months: Colorado Department of Human Services, data received in March 2016; Georgia Department of Early Care and Learning, data received in March 2015; Illinois Network of Child Care Resource and Referral Agencies, data received in February 2016; Maryland State Department of Education, data received in July 2015; Maryland Family Network, data received in April 2016; Child Care Aware of Minnesota, data received in July 2015; North Carolina Department of Health and Human Services, data received in July 2015 ; Ohio Department of Job and Family Services, data received in September 2015; and the Virginia Department of Social Services, data received in July 2015. Center location was available for all centers listed in each of the states’ licensed databases. QRIS participation, ratings, and center capacity were available for select centers within select states. (see Table 5)
Census Bureau American Community Survey 2010-2014 5-Year Estimates
ZIP code tabulation area ACS estimates used in the analyses included: total population; population under 5 years old; the share of residents below the federal poverty line in the previous year; the number of non-Hispanic white residents; the number of non-Hispanic black residents; the number of non-Hispanic American Indian and Alaska Native residents; the number of non-Hispanic Asian residents; the number of non-Hispanic residents of any other race; the number of non-Hispanic residents of two or more races; the number of Hispanic residents of any race; the rate of labor force participation for all women aged 20 to 64; the rate of labor force participation for women aged 20 to 64 with their own child under the age of 6 in the household. ACS poverty and racial/ethnic data were available for 6,836 ZIP codes of the 6,895 ZIP codes included in the analyses. The specific ACS files and variables used are listed below.70
Limitations
The limitations of this study are primarily related to the availability and reliability of the data collected for analysis. While the regulatory and licensing data provided by the nine state agencies is more comprehensive than any publicly available data, it cannot be considered complete or totally accurate. There is likely some delay in the updating of state licensure, leading to some closed centers being included and some newly opened centers being excluded from the analysis. There is also the possibility of variation in state licensure administration and law, so that some states may not include all centers.
This study only considers center-based child care and early education programs, which does not capture the full range of child care arrangements available to families. Home-based programs—such as family-based child care and family, friend, and neighbor care—can provide critical options for many families and are preferred by some parents. However, most 4-year-olds participate in center-based child care.71 Ultimately, most families will want or need center-based programs at some point during their child’s early years, and they deserve a full range of options. Additionally, data on family-based care is unlikely to be shared by state licensing agencies due to privacy concerns. While having the locations of these home-based programs in the dataset would make the picture of child care supply more complete, it is simply not possible at this time.
Another limitation of this analysis is the strict assumption that child care centers should be near a family’s home. Of course, some families may commute to work and need to have child care near their workplaces. An ideal analysis would be able to address this issue, but in reality, this could not be modeled without comprehensive individual-level data.
About the authors
Rasheed Malik is a Policy Analyst with the Early Childhood Policy team at the Center for American Progress, where he focuses on child care infrastructure and financing, as well as disparate impacts of early childhood policy. Previously, he completed a graduate fellowship with the Poverty to Prosperity program at the Center. Malik received his master of public policy from the Gerald R. Ford School of Public Policy at the University of Michigan. Prior to graduate school, Malik was a government affairs and communications associate for the Waterfront Alliance, an organization with the goal of making the New York Harbor a shared, resilient, and accessible resource for all New Yorkers.
Katie Hamm is the Senior Director of Early Childhood Policy at the Center. Prior to joining the Center, Hamm worked as a program examiner at the Office of Management and Budget on federal child care and early education programs, including the Race to the Top-Early Learning Challenge, the Child Care and Development Fund, and the Head Start program. Her work focused on developing budget proposals to strengthen the quality of and access to early childhood programs. She also worked on international issues in early childhood while on detail to the Organisation for Economic Co-operation and Development. Earlier in her career, Hamm worked at the Center for Law and Social Policy and the Institute for Women’s Policy Research on child care and early education issues.
Maryam Adamu is a former Research Associate with the Early Childhood Policy team at the Center. Previously, she was an Emerson National Hunger Fellow with the Poverty to Prosperity Program and the Progress 2050 team, where her work focused on economic and racial justice in light of the 50th anniversary of the Civil Rights Act. She is currently a student at the New York University School of Law.
Taryn Morrissey is an assistant professor in the department of public administration and policy at American University. Morrissey’s work centers on examining and improving public policies for vulnerable children. Her research examines the impacts of early care and education, food assistance, and neighborhood poverty on children’s development. Previously, she held staff positions on the U.S. Senate Health, Education, Labor and Pensions Committee for former Sens. Ted Kennedy (D-MA) and Tom Harkin (D-IA) and at the U.S. Department of Health and Human Services.
Acknowledgements
The authors wish to recognize Rebecca Ullrich and Rachel Herzfeldt-Kamprath for their helpful insights. In addition, the authors would like to thank Alex Rowell and Michael Madowitz for their review of the data and methodology used in this report.
* Correction, October 27, 2016: This report has been corrected to accurately reflect the percentage of the Georgia population that lives in child care deserts, as well as to clarify that $12,376 per year was the cost of preschool for a 4-year-old in Virginia in 2015.