Introduction and summary
After several years of work by a diverse set of citizen groups and government officials, Oregon passed the nation’s first automatic voter registration (AVR) law in 2015.1 It went into effect in January 2016 and was in use for the 2016 elections. Locally termed Oregon Motor Voter (OMV), the program aims to modernize the voter registration system, make voter rolls more accurate and efficient, simplify the registration process for voters and administrators, and increase voter participation.
The system assures that every eligible citizen who interacts with the Oregon Office of Motor Vehicles has an up-to-date registration record and is able to vote. By a wide range of measures, Oregon’s modern voter registration system had positive effects:
- More than 272,000 new people were added to the voter rolls, and more than 98,000 of them were new voters in the November 2016 presidential election.
- OMV registrants made up 8.7 percent of people registered to vote and constituted 4.7 percent of all voters in Oregon.
- More than 116,000 people registered who were unlikely to have done so otherwise, and more than 40,000 of these previously disengaged people voted in the November election.
- Oregon’s electorate is now more representative of the state’s population since citizens registered through OMV are younger, more rural, lower-income, and more ethnically diverse.
This report finds significant demographic and geographic differences between these newly registered voters and those who registered through traditional means. Compared with traditional registrants and voters, AVR registrants and voters were:
- Noticeably younger—about 40 percent of AVR registrants and 37 percent of AVR voters were age 30 or younger. In comparison, 20 percent of eligible Oregon citizens are age 18 to 29
- More likely to live in suburban areas and less likely to live in urban areas
- More likely to live in low- and middle-income areas
- More likely to live in lower-education areas
- More likely to live in racially diverse areas—the average AVR registrant’s community was more Hispanic and less white than that of traditional registrants
While every state may have different attributes, Oregon provides strong evidence in favor of automatic voter registration. AVR strengthens democracy by expanding and broadening the electorate. AVR’s streamlined systems can save states and localities significant costs, make the voter registration lists more accurate and up to date, and increase the security of the voting system. AVR is the next logical step in creating an efficient, secure, and modern voter registration system for the 21st century.
For a full-size version of the interactive, click here.
How automatic voter registration works in Oregon
Under Oregon’s AVR system, eligible citizens are automatically registered to vote through records collected by the Office of Motor Vehicles. All the information necessary to determine voting eligibility for general elections is already required by the agency in its applications for driver’s licenses, learner’s permits, and identification cards.
When Oregonians provide their name, address (residence and/or mailing, if applicable), birthdate, and citizenship information to the Office of Motor Vehicles, the agency transmits the information to the Elections Division of the Office of the Secretary of State. Only individuals who confirm their citizenship through the Office of Motor Vehicles transaction are added through AVR. Information for applicants who demonstrate their residence in another way and individuals with protected or confidential records are not transmitted to the secretary of state.
Once the Oregon Elections Division receives qualifying voter records from the Office of Motor Vehicles, it sends postcards to newly registered voters informing them that:
- They will be registered to vote through AVR.
- They can decline to be added to the voter registration list by signing and mailing back the postcard.
- They can register with a political party by returning the postcard, which allows them to participate in the state’s closed partisan primary elections.
Potential registrants have 21 days to return the postcard before further action is taken. Citizens who do not return the postcard are added to the voter registration list as nonaffiliated voters. Individuals can change their registration status, including party affiliation, at any time through Oregon’s efficient online voter registration system or by submitting a form to a county elections office.
The Office of Motor Vehicles also forwards address updates to the Oregon Elections Division, which checks the new information against the current records and updates the voter’s address if it is newer than the address information on the registration file.
Oregon is using available technology to make a simple switch and transform the voter registration paradigm. In this way, Oregon’s AVR is an election reform that hits the administrative sweet spot by both improving election security and integrity and expanding voting access.
AVR registration and turnout totals
The Office of the Oregon Secretary of State reported that 238,876 Oregonians registered as unaffiliated voters through the AVR system in 2016, and another 33,826 sent the postcard back to affiliate with a political party.2 In all, 272,702 individuals were automatically registered to vote and more than 98,000 subsequently went on to vote in the 2016 presidential election.
However, how many people did AVR register who would not have registered themselves? How many of them turned out who would not have voted otherwise?
Without the benefit of a controlled experiment, definitive answers to these questions are not available, but some educated guesses are possible. Using the data available in the voter file, let us assume that people with a low probability of registering themselves had the following characteristics:
- They were not registered during the 2008, 2010, 2012, or 2014 elections.
- They were old enough that they could have been registered and voted since 2008.
- They did not return their registration postcard.3
Using those criteria, more than 116,000 people who were registered through OMV would probably not have registered otherwise. Of those, more than 40,000 voted in 2016.
As of October 31, 2016, 1.4 million records had been electronically transmitted from the Office of Motor Vehicles to the secretary of state, and about 75 percent of these records matched an existing registered voter. The secretary of state’s office sent 304,227 mailers that notified people of a new registration.
Of the 304,227 mailers sent, 9,485 were undeliverable and thus not registered—a little more than 3 percent of all postcards—while 25,112 eligible citizens decided to decline registration and returned their postcard indicating that choice. The 269,130 eligible individuals were forwarded to the county clerks, who added them to the rolls. Of those 269,130 voters, 32,430, or 11 percent, returned their cards to choose a political party.
While turnout was up across the country in the 2016 election cycle, Oregon experienced the largest surge of any state—a 4.1 point increase compared with 2012.4 Given the results above, it seems reasonable to say that AVR played a large part in that increase.
The geography and demography of OMV registrants
A well-known feature of American politics is that the processes for registering voters in each state—typically more difficult than in most other democratic nations—results in a registered voter population that is different than the general population.5 Registered people tend to be older, more educated, have higher incomes, and are, as a group, less racially diverse than the total pool of eligible citizens of voting age.6
Therefore, when a state changes the registration process, it’s important to ask whether the changes reinforce those differences or diminish them. The following section answers this question for AVR in Oregon using demographic and geographic data from the statewide voter registration file, which includes individuals’ home addresses and dates of birth. (see Methodology section for more detail on the use of the addresses)
Age
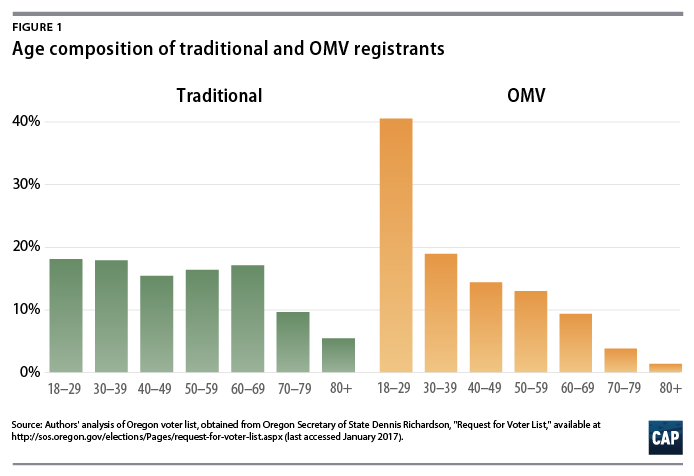
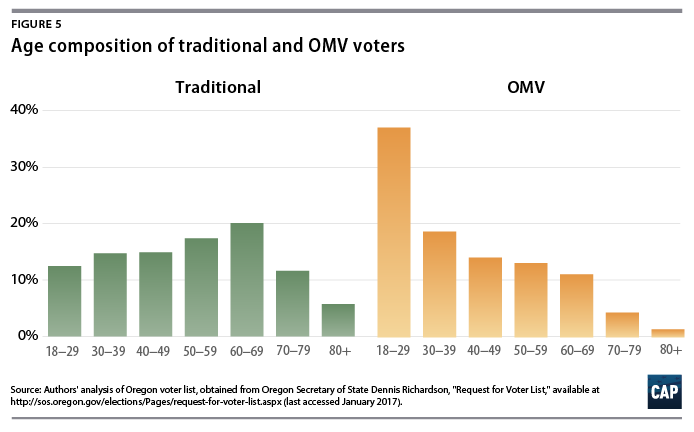
OMV registrants were much younger than traditional registrants.
While AVR in Oregon was not specifically designed to target the youngest voters, it did wind up registering a disproportionately young group of people. People ages 18 to 29 made up about 18 percent of traditional registrants in 2016 but a little more than 40 percent of OMV registrants. In comparison, 18- to 29-year-olds are approximately 20 percent of Oregon’s eligible citizen population.7
Rural versus urban
OMV registrants lived in less urban and more suburban areas compared with traditional registrants.
Using the geographic data in the voter file and rural categories developed by the U.S. Department of Agriculture, the authors categorized all registrants as living in urban or rural ZIP codes.8 OMV registrants were less likely to live in areas classified as “metropolitan core” than their traditionally registered counterparts (67.7 percent versus 61.4 percent) and more likely to live in nonmetro but urban-adjacent areas (14.3 percent versus 17.6 percent). In other words, compared with traditional registrants, OMV registrants were less likely to come from dense urban areas and more likely to come from the suburbs surrounding cities.
Income
Compared with traditional registrants, OMV registrants lived in areas with lower incomes.
The median OMV registrant lived in an area with a median income of $49,886. The same figure for a comparable traditional registrant was $54,200.9 Figure 2 displays the distribution of OMV and traditional registrants across neighborhoods of differing median incomes. OMV registrants were much more likely to come from places where the median income is less than $60,000 compared with traditional registrants (67.5 percent versus 59.3 percent). Traditional registrants were more likely to live in higher-income areas.
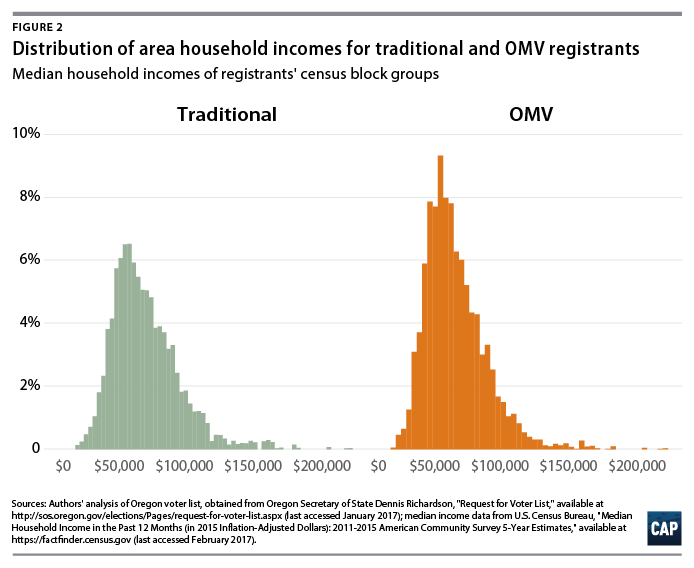
Additionally, the median OMV registrant came from an area where 12.7 percent of households had experienced poverty in the past 12 months compared with only 11.3 percent for a traditional registrant.
Race
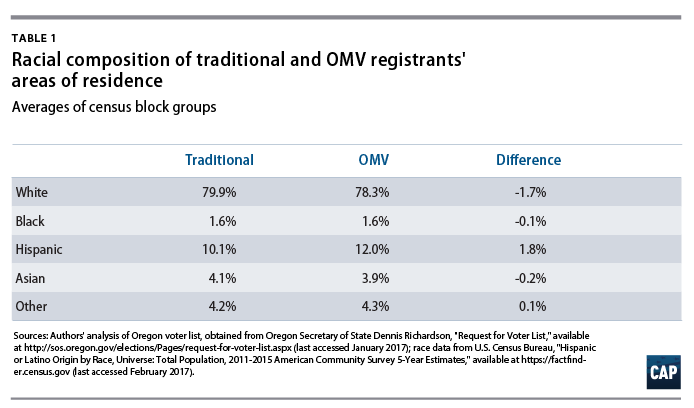
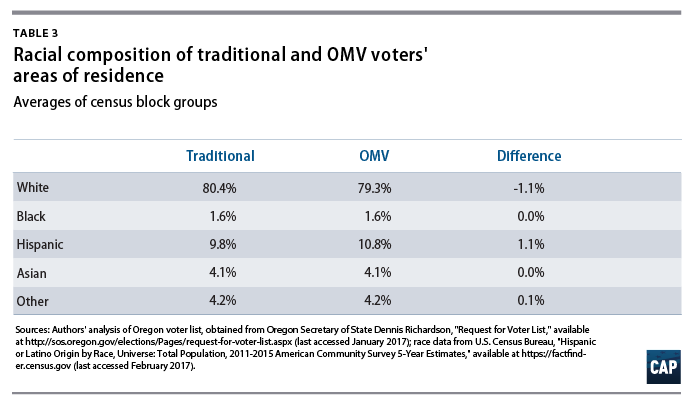
OMV registrants lived in areas that were less white and more Hispanic than traditional registrants.
The average area in which an OMV registrant lived was 1.6 percent less white and 1.8 percent more Hispanic than the comparable area of a traditional registrant. As shown in Table 1, OMV registrants were also more likely to be located in areas that were less black and less Asian, but these differences were relatively minor.
Education
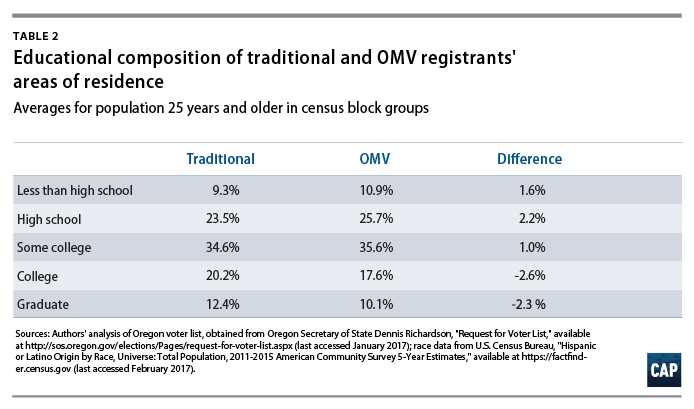
OMV registrants lived in less educated areas when compared with traditional registrants.
As shown in Table 2, OMV registrants were more likely to live in areas where people had a lower level of education. Specifically, individuals in the areas where OMV registrants lived were more likely to have an education level classified as less than high school, high school, or some college. Traditional registrants were more likely to live in areas where people had higher levels of educational attainment.
Geographic distribution
While OMV registrants made up 8.7 percent of registered voters in the 2016 election, OMV registration was not evenly distributed around the state. Some communities had a larger percentage of their population registered through AVR while others had a smaller percentage. Figure 3 breaks down areas into six categories based on how many of their registered voters were registered through OMV—less than 3 percent; 3 percent to 5.9 percent; 6 percent to 8.9 percent; 9 percent to 11.9 percent; 12 percent to 14.9 percent; and 15 percent or more. Figure 3 shows that most people who were newly registered to vote through the system lived in places where a substantial percentage of registrants were registered through OMV.
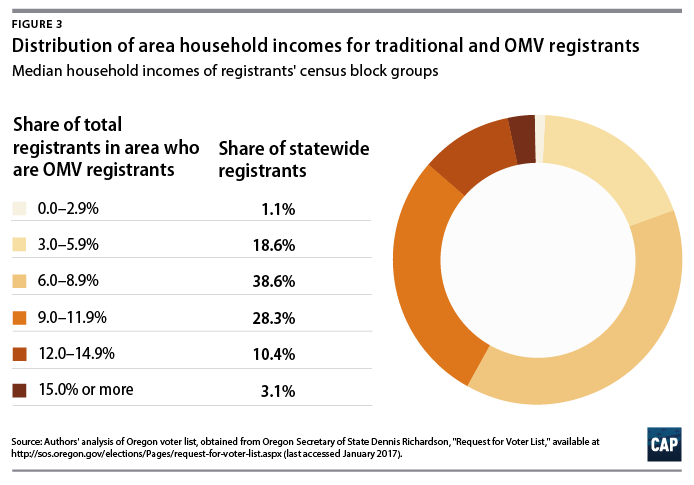
In fact, a little more than 12 percent of registered voters lived in areas where 12 percent or more of the registrants were registered through the OMV. Only a very small percentage of registered voters (about 1 percent) lived in a place where less than 3 percent of the registered voters were OMV registrants.
Geopolitical guide to Oregon
Oregon is divided geographically—and politically—between the Willamette Valley and eastern Oregon.
The Willamette Valley, including the Portland-Salem metro area near the northern border, runs between two mountain ranges in the western third of the state. It is the most economically vibrant and ethnically diverse portion of the state, accounts for about 70 percent of the state’s population, and generally votes Democratic.10 The suburbs around Portland and Salem, as in many states, lean more centrist and are the focus of statewide and national political campaigns. Corvallis and Eugene, home to the state’s two flagship public universities, are in the central portion of the valley, and the central and southern valley is the home of Oregon’s fabled wine industry.
Eastern Oregon is generally demarcated as everything east of Mount Hood and the Cascade Range. Eastern Oregon is mostly rural and relies on agriculture and forestry for its economic vitality. Politically, the eastern portion has been described as “conservative populist” and votes reliably Republican.11
Beyond these broad regions, there are two other areas of Oregon that deserve note. Central Oregon—notably the Bend-Redmond metro area—has been one of the fastest growing regions in the past decade, with a particular influx of retirees.12
Coastal Oregon has also experienced substantial population and economic growth, but like Central Oregon, this is almost exclusively limited to incoming retirees and the tourism industry.13 This region is particularly distinctive in that the coastal wealth is contiguous to some of the most impoverished parts of the state. These coastal counties have been hit hard by the decline of the timber industry and consequent collapse in local tax revenues.14
There is substantial geographic variation in OMV registration—“hot” and “cold” spots with a higher or lower than average share of OMV registrants. Although these results are preliminary, Figure 4 shows that many of the areas with a below average share of OMV registrants (displayed here in green) were clustered in Portland city proper and the western suburbs and follow Oregon Route 99W—a state highway that passes through comparatively well-off agricultural areas and two college towns. OMV likely did not add as many new voter registrants in these areas because they already had high registration rates—a function of the population’s relatively higher income and education levels. The other “cold spots”—Bend and Redmond in the center of the map as well as small Wallowa mountain towns in the far northeastern corner of the map—fit a similar pattern.
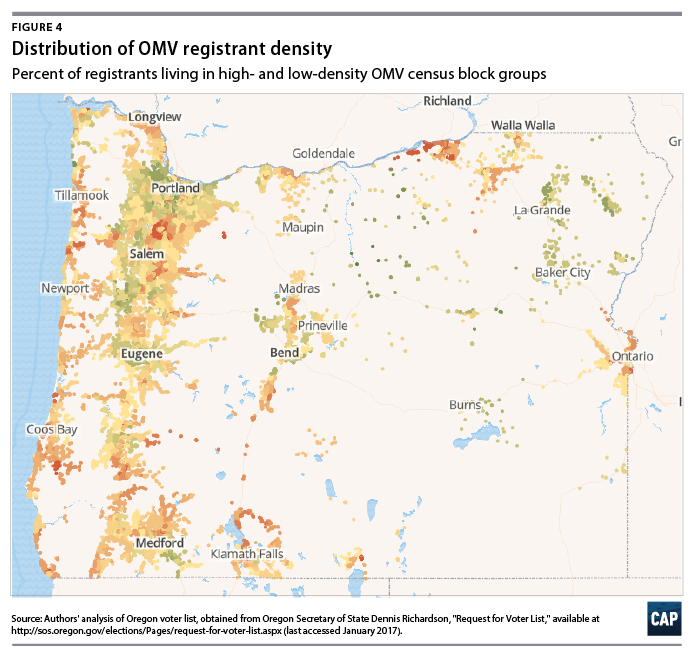
OMV resulted in a comparatively higher rate of registration in the “hot spots” colored orange on the map. Much of the coast appears orange, but what is not visible at this resolution is that most of the orange is inland, just off the coast, while the wealthier coastline areas are, in fact, green. This is the first hint that OMV benefitted areas that are facing economic decline—even when they are geographically contiguous to well-off areas.
In the Portland metro area, the “hot spots” are quite distinctive to any observer familiar with the rapid changes that the region has experienced over the past decade. Most of the orange is concentrated in areas immediately east of Portland, areas with higher proportions of middle- and lower-income citizens and the home of most of Portland’s communities of color. This pattern continues south through communities clustered along the Interstate 5 corridor.
At the southern tip of the Willamette Valley, the same pattern evidenced on the coast repeats itself. The green area is Medford and Ashland—the only pockets of wealth in the area. The orange regions are Grants Pass to the east, a city hit hard by the timber downturn, and Klamath Falls to the west, an agricultural town that has been engaged in a long-running dispute over water rights.
Finally, the bright patches of orange in the northeastern portion of the map extending down the eastern edge represent the cities of Boardman, Pendleton, Umatilla, and Ontario, which are just over the Idaho border and made up of ranch and farm country. The splotches of green, noted above, are small tourist areas in the Wallowa mountain range.
In summary, while the most populous areas saw more OMV registrations in total, the system created the most added value in regions that saw a substantial number of new residents or were particularly battered by changes in Oregon’s economy over the past 20 years.
Turnout, geography, and demography of OMV voters
While the registration numbers outlined above are impressive, the eventual standard by which Oregon’s AVR program will be judged is whether it spurs greater civic participation. In short, do the individuals registered through OMV show up to vote?
In the November 2016 election, 84.1 percent of traditionally registered voters—more than 2 million people—cast a ballot in Oregon, a high bar for participation. OMV voters turned out at more than half that rate—43.6 percent.
However, it is important to put this turnout rate in context. First, as detailed earlier, OMV registrants were markedly younger than their traditional registrant counterparts. As such, any comparison needs to take this into account. After accounting for these differences by weighting the OMV registrants as if their age distribution matched that of the traditionally registered population, the age adjusted OMV turnout rate is a bit higher—46.6 percent.15
Second, many OMV registrants have been disengaged from the political process for an extended period of time. Under these circumstances, a turnout rate of more than half that of traditional registrants is not only an accomplishment—it is also a gap that is expected to close as individuals become more involved in political life.
Third, as with all things, variation is expected. That is, while 43.6 percent may be the average turnout rate for OMV registrants, this number is likely to vary based on important demographic, political, and geographic characteristics. This section explores how turnout varied by age, demography, geography, and whether one affiliated with a party.
Put simply, did the differences among registrants carry over into those who showed up and voted on election day? By and large, the answer is yes. Although more muted than the differences between OMV and traditional registrants, OMV voters are also demographically and geographically distinct from their traditional counterparts.
Age
OMV voters were much younger than traditional voters.
Just like OMV registrants, OMV voters were disproportionately young. Those ages 18 to 29 made up about 13 percent of traditional registrants who voted but a little more than 37 percent of OMV voters. For reference, 18- to 29-year-olds make up 20 percent of Oregon’s eligible citizen population.16
Rural versus Urban
Compared with traditional voters, OMV voters lived in less urban and more suburban areas.
Using the same ZIP code rurality categories employed in the previous section, the authors found similar results for voters who were registered through the OMV. Compared with traditional voters, they were less likely to come from metropolitan area core ZIP codes (68.1 percent versus 64.9 percent) and more likely to come from nonmetro but urban-adjacent areas (14.1 percent versus 16.1 percent).
Income
Compared with traditional voters, OMV voters lived in lower-income areas.
The median OMV voter lived in an area with a median income of $49,886. The same figure for a comparable traditional voter was $55,446. The median OMV voter came from an area where 11.7 percent of households had experienced poverty in the past 12 months compared with only 10.8 percent of their traditional counterparts.
Race
Compared with traditional voters, OMV voters lived in areas that were less white and more Hispanic.
Just like registrants, OMV voters, on average, lived in places that were more racially diverse. The average OMV voter lived in an area that was 1.1 percent less white and 1.1 percent more Hispanic.
Education
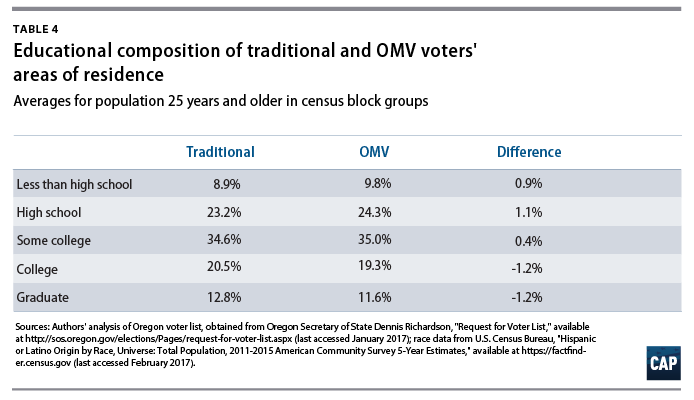
Compared with traditional voters, OMV voters lived in less-educated areas.
As shown in Table 4, OMV voters were more likely to live in areas where people had a lower level of education. Specifically, individuals in the areas were OMV voters lived were more likely to have an education level classified as less than high school, high school, or some college.
Geographic distribution
While OMV voters made up 4.7 percent of all voters at the state level, OMV voters were not evenly distributed geographically. Some communities had a larger percentage of their voting population registered through the system while others had a smaller percentage. Figure 6 breaks down areas into five categories based on how many of their voters were registered through OMV—less than 2 percent; 2 percent to 3.9 percent; 4 percent to 5.9 percent; 6 percent to 7.9 percent; and 8 percent or more.
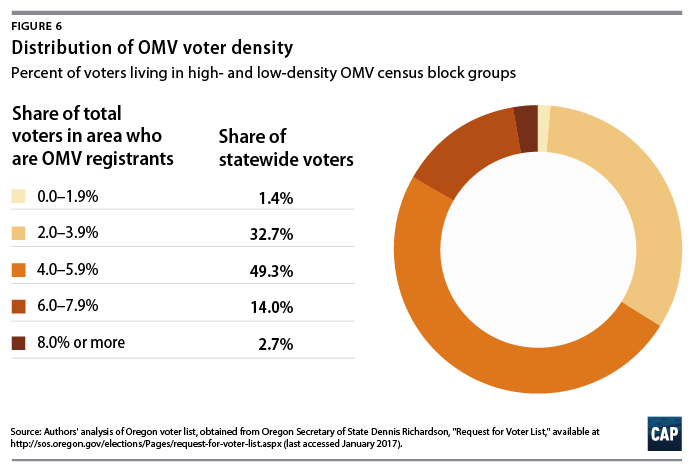
Looking at the composition of voters, Figure 6 shows that most people who voted after registering through OMV lived in places where a substantial percentage of voters were registered through OMV. In fact, over 16 percent of voters lived in places where 6 percent or more of the voters were registered through the OMV. Only a very small percentage of voters (about 1.4 percent) lived in a place where less than 2 percent of the voters were OMV registrants.
Party affiliation and turnout
OMV registrants who affiliated with a party were much more likely to vote.
A well-established finding within political science is that there is a relationship between party affiliation and turnout—people who strongly identify with a party also tend to have higher participation rates.17 Causally, it seems likely that the story cuts both ways. On the one hand, individuals who are politically engaged are more likely to be partisans. On the other, the very act of identifying with a party makes it more likely that political campaigns spend time and money to get you to the polls.
To examine this relationship, the authors broke registrants down into four groups: party-affiliated traditional registrants, unaffiliated traditional registrants, party-affiliated OMV registrants, and unaffiliated OMV registrants. Figure 7 displays the turnout rate of these four groups, with two striking features.
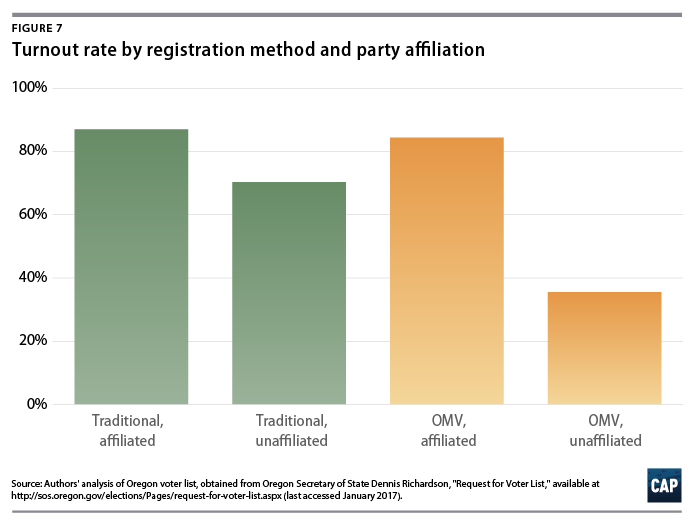
First, despite the turnout differences between OMV and traditional registrants discussed earlier in the report, the turnout rate of party-affiliated OMV registrants was nearly identical to the turnout of their traditional counterparts—a difference of about 2.6 percentage points, about 84.9 percent compared with 87.5 percent.
Second, the turnout rate of unaffiliated OMV voters was dramatically lower than their affiliated OMV counterparts—about 35.7 percent compared with 84.9 percent. Again, this is likely influenced by the dynamics surrounding the act of being on a party list and the attendant campaign and candidate outreach that ensues as a result.
A deeper look at age and turnout
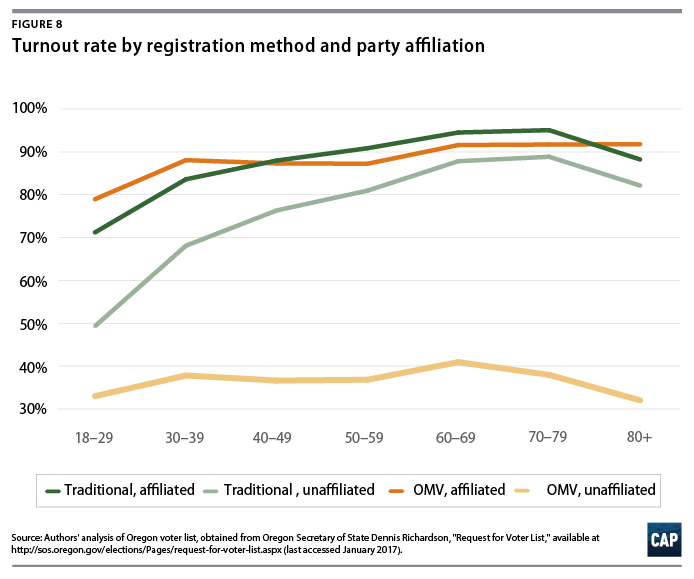
The differences in turnout can be examined at an even deeper level by adding age into the mix. Figure 8 displays Oregon’s turnout by registration method (traditional versus OMV), party affiliation (affiliated with any party versus unaffiliated), and age group.
Affiliated OMV and traditional registrants have nearly identical turnout rates, even accounting for age, but unaffiliated voters are far less engaged regardless of their registration method. This matches expectations: Registrants who take an active step, such as affiliation with a party, are much more likely to participate because they have already shown a preference for engagement.
However, the typical relationship between turnout and age—with turnout generally going up as registrants get older—is not as strong among OMV registrants. The lines that represent party-affiliated and unaffiliated OMV registrants are much flatter than their traditionally registered counterparts. Put another way, younger and older OMV registrants have turnout rates that are much more similar than younger and older traditional registrants.
A deeper look at geography and turnout
Figure 9 identifies areas where OMV registrants turned out at rates that were comparatively higher (orange) or lower (green) than average OMV turnout.18
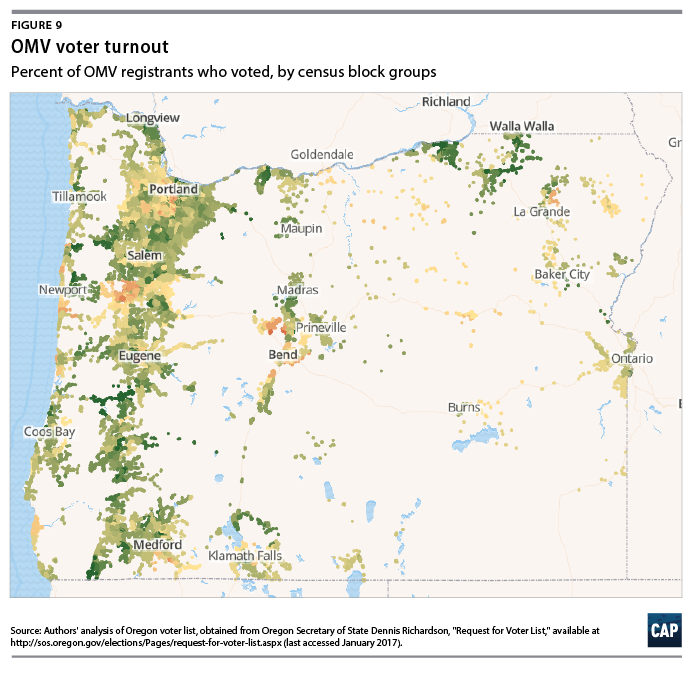
Again, this analysis is preliminary, but some clear geographic patterns emerge out of the data. Areas that showed comparatively low levels of OMV registration often showed higher levels of turnout among the OMV registrants. For example, the high-density areas around the state highway that travels through wine country and two college towns—99W—are also the places where OMV registrants turned out to vote at the highest rate. Yet, just immediately to their east, along Interstate 5, OMV registrants turned out at rates lower than average. Similarly, the central metro areas of Portland—areas that saw a substantial number of new residents, rising home prices, and mobility—turned out at higher rates than average OMV registrants, while areas only a few miles to the east showed some of the lowest turnout rates for OMV registrants.
These patterns illustrate that while facilitating voter registration is a first step in re-engaging disengaged voters, it does not guarantee that these registrants will subsequently vote.
Learning from Oregon
This study demonstrates the significant effect that AVR had on voter registration and turnout in Oregon. Additionally, there are lessons to be learned from Oregon for use in other states—both in terms of what to think about when trying to pass AVR and how to ensure that it results in sustained engagement.
In the years leading up to the passage of OMV, The Oregon Bus Project, an organization that helps young people register, began discussing a more efficient way to increase civic engagement among eligible Oregonians. After looking at how other countries register voters, it determined that the best policy would be an AVR system that allows all eligible Oregonians to get automatically added to the rolls.19
First introduced in 2013, the AVR bill became a legislative priority in the 2015 session. Nonpartisan community groups played a significant role in finally achieving passage. Oregon county clerks and a broad coalition of good-government groups and organizations—including AARP, the Asian Pacific American Network of Oregon, the Urban League of Portland, student groups, and disability rights groups—testified in favor of the bill.20
The bill passed both chambers, and the new Oregon Gov. Kate Brown (D)—who had led the push for AVR as secretary of state—signed it into law.21 Then-Secretary of State Jeanne Atkins (D) successfully implemented OMV in time for the 2016 general election, and current Secretary of State Dennis Richardson (R) has continued to successfully implement the OMV process since being elected in 2016.22
Three pieces of advice emerged from Oregon’s experience, among many others:
- Focus on technology right from the start: Assessing the technological capacity and procedures used by the Oregon Office of Motor Vehicles and the secretary of state was critical to ensuring that the AVR system works accurately, efficiently, and safely.
- Bring together people with a wide range of expertise and perspectives and make sure they stay involved from start to finish: Involving a wide range of stakeholders from all parties and backgrounds facilitated smooth implementation of the Oregon law. By engaging partners throughout the process—from passage of the law to rulemaking and implementation—Oregon addressed privacy and confidentiality questions; ensured that county clerks had the tools they needed; and ultimately facilitated the results described above.
- Increase education around civic engagement: The number of unaffiliated citizens who voted suggests that OMV can continue to improve participation in rural and urban areas alike with increased civic education. AVR provides the opportunity to raise the awareness of and interest in participating in elections because the step of registration has already been achieved. In the case of Oregon, outreach could focus on the 54 percent of OMV registrants who did not vote.
Conclusion
This report provides an in-depth analysis of the impact AVR had in Oregon in 2016—in terms of raw numbers and percentages—and breaks down the data demographically.
The main finding of this analysis is clear: by a variety of measures, AVR was successful in improving registration and voting in Oregon and is a reform that ought to be pursued in other states. AVR makes state registration systems more accurate, efficient, and cost-effective, and the data here demonstrate that it can increase the level of participation in a state’s elections. It provides more citizens with an opportunity to use their voices in America’s democracy.
Through AVR, hundreds of thousands of Oregonians became registered voters. Almost 100,000 of those new registrants voted in the 2016 election—constituting 4.7 percent of all voters. Evidence is strong that tens of thousands of those citizens would not have voted if not for the AVR system.
The findings regarding who registered and turned out to vote because of Oregon’s first-in-the-nation registration modernization also provide a great deal of information for other states moving forward with their own AVR plans. To many, the effects may seem unexpected:
- AVR disproportionately reached one of the lowest participating groups in the nation: young people.
- AVR registrants and voters were less urban than traditional registrants.
- AVR registrants and voters lived in areas with lower incomes and less education than traditional registrants.
- AVR registrants and voters lived in areas that were more Latino than traditional registrants.
Six states and the District of Columbia have all adopted AVR systems.23 Data about the effect of these programs, and other policies that make major improvements to voter registration, will be analyzed as they are implemented. Researchers and administrators are starting to collect data now, and early indications are promising.
America is stronger when more citizens participate in our democracy. The administrative, security, and cost benefits provided by AVR and its capacity to include more eligible voters and increase participation among citizens from a variety of different walks of life demonstrate that AVR is a reform whose time has come in America.
Methodology
Geocoding, spatial joining, and community data
Oregon voter file contains the street address, city, and ZIP code for each registrant. These pieces of data can be translated into latitude and longitude points via a process called geocoding.
Using a technique called spatial joining, those latitude and longitude points were used to identify the geographic areas—states, counties, census tracts, etc.—in which registrants lived. For this study, the authors identified and analyzed the census block groups.24 The population size of this type of area varies—containing between 600 and 3000 people—but can generally be thought of as a rough proxy for an individual’s local community. Finally, the authors appended data about each of the block group’s demographic, economic, and social characteristics using data from the 2011–2015 American Community Survey 5-year estimates.25
Modeled turnout
To accurately estimate the turnout rates of fine-grain groups in Oregon, this report utilized a cross-nested multilevel model.
This process began by breaking the registered population into more than 73,000 groups based on:
- The method of their registration (OMV versus traditional)
- Whether they were registered with a political party (affiliated versus unaffiliated)
- Their age group (18 to 29, 30 to 39, 40 to 49, 50 to 59, 60 to 69, 70 to 79, 80 and older)
- Their geographic location (county, census tract, and census block group)
From there, registrants’ turnout rates were modeled with cross-nested group-level predictors indicating their county, tract, and block group as well as their method of registration, affiliation status, and age group. In contrast to a straightforward read of the data—which will invariably produce extreme estimates for low-sample populations—this approach provides more accurate results by partially pooling estimates across these geographic, demographic, and political characteristics.
Age-adjusted turnout
To account for the age differences between OMV and traditional registrants, the authors calculated turnout rates using standard age-adjustment techniques.26 In essence, this procedure involved calculating the turnout rate for small age bands of a given group—in this case, OMV and traditional registrants for the age groups listed above—and then poststratifying the groups by a standard population weight.
To calculate those rates, the authors used a simplified version of the model described above—a cross-nested multilevel modeling using registration method, age group, and county as group-level predictors. With those turnout rates calculated, the authors then used the population distribution of the traditional registrant population to reweight the rates of OMV turnout and derive the age-adjusted figure.
About the authors
Robert Griffin is a senior policy analyst at the Center for American Progress, focusing on demographic change and American political behavior. He is the co-author and lead data analyst for the “States of Change” Project—a collaboration between the Center for American Progress, demographer William H. Frey of the Brookings Institution, the American Enterprise Institute, and the Bipartisan Policy Center—which has projected demographic changes from 1980 to 2060 in all 50 states, detailed the potential political impacts of those changes, and documented past and future representation issues in the American electorate. He has taught courses on research methodology, statistics, public opinion, and political advocacy for The George Washington University, Pennsylvania State University, and Loyola University Chicago.
Paul Gronke is a professor of political science at Reed College in Portland, Oregon. He specializes in convenience and early voting, election administration, public opinion, and elections. In 2005, he established the Early Voting Information Center, which has worked with a number of state and local governments, secretaries of state and state election directors, federal agencies, and nonprofit organizations to provide evidence-based solutions to issues related to early voting and election administration. He is editor of the Election Law Journal, an interdisciplinary journal of election law, administration, and politics, and co-editor of PS: Political Science & Politics, one of three flagship journals of the American Political Science Association.
Tova Wang is director of policy and research at the Center for Secure and Modern Elections and a senior democracy fellow at Demos. She has 20 years of experience working for and with advocates, academics, and policy leaders on improving democracy. She has focused on issues related to greater political inclusion in the United States, including major studies on increasing voter participation rates among low-income people, communities of color, naturalized immigrants, women, and Native Americans. Her critically acclaimed book, The Politics of Voter Suppression: Defending and Expanding Americans’ Right to Vote, was published in 2012 by Cornell University Press. She also consults international organizations and public officials on voting rights and election reform in countries around the world. Her commentary on voting and participation has appeared in numerous print media outlets, including The New York Times, The Washington Post, The Hill, and Politico, and she has appeared on numerous national television and radio news shows.
Liz Kennedy is director of democracy and government reform at the Center for American Progress. She engages in research, policy development, and public advocacy to rebalance democracy by constraining the anti-democratic power of wealthy special interests over government and empowering voters so government works for people. Kennedy is the author of many papers and regularly speaks on issues including conflicts of interest, lobbying and corporate political influence, campaign finance reform, voting rights, voter suppression, and redistricting. Prior to joining CAP, Kennedy worked on voting rights, money in politics, and democratic accountability as counsel and campaign strategist at Demos and as an attorney in the Democracy Program at the Brennan Center for Justice at the New York University School of Law.