Most analyses of America’s demographic revolution focus on the fact that people of color will comprise a majority of the country’s population in about 30 years—specifically, 2044 by the U.S. Bureau of the Census’ latest estimates. A question often underlying these analyses is: “How will this browning of America affect our country’s politics?” While the explosive growth of this group is a transformative element of modern American politics, another important and often overlooked question is: “What about white voters?” That is, how will the voting tendencies of whites affect election outcomes as our country moves toward becoming a majority-minority nation?
The majority of whites have voted Republican in every election over the past 50 years, but a meaningful minority of whites support the Democratic nominee every election. The latter fact raises yet another question: Just how many—or how few—Democratic white voters are there? The answer has implications not just for 2044 but also for the outcome of the 2016 election. The historic evidence suggests that Democratic whites comprised 34 percent to 48 percent of all white voters—and that 34 percent number is a floor.
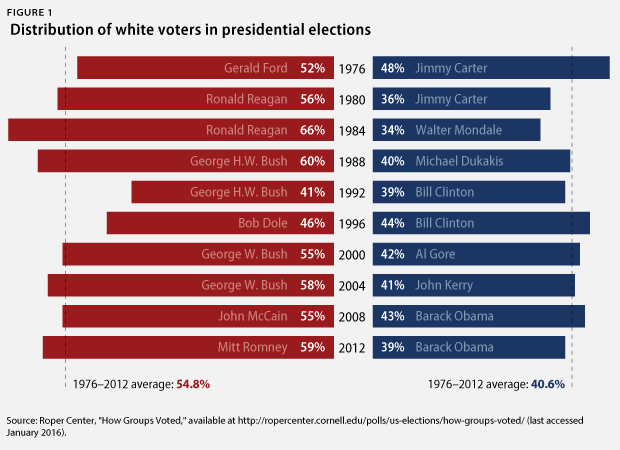
The national exit polls have broken out their survey results by racial group since 1976, and since that year, the Republican nominee for president has received, on average, 54.8 percent of the white vote, while the Democratic nominee has garnered an average of 40.6 percent. In 1980, 1992, and 1996, third-party candidacies affected the distribution of the white vote. The highest percentage secured by a Republican was the 66 percent won by Ronald Reagan in his landslide re-election in 1984; the lowest Democratic number was Walter Mondale’s 34 percent in that same election. Jimmy Carter received the largest percentage of white votes for a Democrat with 48 percent in 1976; George H.W. Bush received the lowest at 41 percent in 1992 when Ross Perot ran, splitting the white vote and dropping Bush from the 60 percent white share he received in 1988.
Another data set helping to quantify the partisan size of the white electorate was the Pew Research Center’s large typology study in 2014. Pew surveyed 10,000 adults and identified eight typologies of people, with three of those typologies tending to favor Democrats—what Pew termed Solid Liberals; Next Generation Left; and Faith and Family Left. The percentage of whites who fell in those three groups was 37 percent of those surveyed. Of the groups favoring Republicans, they identified Steadfast Conservatives; Business Conservatives; and Young Outsiders. The percentage of whites who fell into those three groups was 44 percent of those surveyed.
Public opinion polls are less accurate than exit polls because they only survey likely voters instead of actual voters and are, therefore, inherently speculative as they relate to future behavior. They nonetheless provide a useful data set that is more current than exit polling. Although not all polls of the 2016 election have offered race-specific crosstabs, those that have comport with the percentages revealed through all the presidential exit polls since 1976, as well as the 2014 Pew survey. In a December 2015 Public Policy Polling, or PPP, poll posing head-to-head matchups of the possible Democratic candidates versus the possible Republican candidates, the white vote comes out anywhere between 33 percent to 36 percent in support of the potential Democratic candidates and 49 percent to 53 percent in support of the potential Republican candidates.
These three data sets all indicate that there is a core white voting bloc in each party, with the numbers showing at least one-third of white voters consistently favoring Democrats and about half or more regularly favoring Republicans.
What are the implications of this for 2016? First, the percentage of white voters needed to win a national election continues to decline for Democrats and climb for Republicans as the electorate becomes more and more diverse every year. President Barack Obama received 5 million fewer white votes in 2012 than he did in 2008, and he still prevailed over former Massachusetts Gov. Mitt Romney, who received 59 percent of the white vote—one of the highest percentages of the white vote in the past 40 years. President Obama netted 39 percent of the white vote in 2012, but he actually would have won the popular vote with as little as 36.5 percent of the white vote. As the Center for American Progress report “The Path to 270 in 2016” predicts, the 2016 electorate will likely be even more diverse than the 2012 voting pool: The percentage of white voters is projected to decline from the 72 percent share that made up the 2012 electorate. To put this figure into context, the 1976 electorate was 89 percent white. If whites are 71 percent of the 2016 electorate and the votes of people of color split the same way they did in 2012, then Republicans would need 63 percent of white voters to win, while Democrats would require only 36 percent of the white vote.
A critical variable determining the significance of the white vote in 2016 is the size and partisan breakdown of the votes of people of color. If every eligible voter casts a vote, and the various racial groups vote with the same partisan breakdown as they did in 2012, the Democratic presidential nominee would win in 2016. People of color comprise 29 percent of all eligible voters. In 2012, they made up 28 percent of the people who cast ballots. Of those who voted, 80.5 percent voted for President Obama and 19.5 percent voted for Gov. Romney. If fewer people of color vote in 2016, however, then the numbers will change: Republicans could prevail with a lower percentage of whites, whereas Democrats would need a higher percentage of these same voters. And if the partisan preferences of voters of color change, that also scrambles the equation regarding which party would prevail in 2016.
Part of the 2016 race will involve a contest for the rapidly growing population of people of color. But a critical and often overlooked consequence of the swelling ranks of communities of color is the changing calculus of how many—or how few—white voters are now required for each party to prevail. It is a distinct possibility that the real question for the 2016 election will be whether Republicans can attract more support from whites who traditionally vote Democratic.
Steve Phillips is a Senior Fellow at the Center for American Progress and author of Brown is the New White: How the Demographic Revolution Has Created a New American Majority, out now from New Press.