Introduction and summary
“We have a once-in-a-generation chance to build an infrastructure that equitably creates opportunities for Americans, instead of further isolating them. We must act.” – U.S. Secretary of Transportation Pete Buttigieg1
As a presidential candidate, Joe Biden promised to build America back better from the ravages of the coronavirus pandemic, including through robust infrastructure investments that would create millions of strong, middle-class jobs and set the country on a path to meeting its climate goals. Moreover, the Biden plan embraced targeting at least 40 percent of federal funds to disadvantaged communities facing sustained economic hardship.2 As U.S. Secretary of Transportation Pete Buttigieg stated at a recent event, “Now is the time to finally address major inequities—including those caused by highways that were built through Black and Brown communities.”3
The administration is right to focus on how infrastructure investments can facilitate inclusive prosperity, redress past harms, and advance national climate goals. Unfortunately, the current structure of federal transportation programs—especially highway programs—is not designed to achieve these progressive goals.
An effective economic stimulus package that delivers real benefits must include significant structural reforms to ensure that federal expenditures do not lead to more emissions, increased barriers to opportunity, and an unsustainable development pattern. Congress must require states to prioritize projects that will reduce air pollution and greenhouse gas (GHG) emissions, redress the economic damage and social dislocation of past highway projects, and provide people with safe, affordable access to economic opportunity.
Each year, states receive billions of dollars in federal highway funding based on formulas set in law. These formulas reflect political negotiations as opposed to objective measures of need or the quality of the projects planned for construction.4 In effect, federal highway funds operate as a loosely structured block grant that lacks accountability. Moreover, states typically define success by how many cars a highway moves per hour rather than using substantive measures of social, economic, or environmental progress. As a result, states often prioritize projects that fail to provide clear benefits or to advance national policy goals. Yet even when states make poor investment decisions, the money continues to flow.
To ensure that federal stimulus spending in the wake of the COVID-19 pandemic delivers substantive economic and social benefits—particularly to disadvantaged communities—states and metropolitan regions must work closely with local communities when designing and selecting infrastructure projects. Importantly, there is a big difference between building in economically distressed communities and building for the people of those communities. Simply because dollars flow to a certain geographic area does not mean that the residents in that area benefit. Progressive rhetoric about economic growth and empowerment can serve to obscure when projects are a continuation of the status quo.
Importantly, there is a big difference between building in economically distressed communities and building for the people of those communities.
The stimulus bill should include five key policy changes to achieve long-term growth and inclusive, sustainable prosperity. First, any funds distributed to states through formula programs should be reserved exclusively for repair, rehabilitation, and reconstruction projects. Second, any funds for capacity expansion projects should be distributed by the secretary of transportation through discretionary grant programs such as Rebuilding American Infrastructure with Sustainability and Equity (RAISE) grants, formerly known as the Transportation Investment Generating Economic Recovery (TIGER) grant program. Third, Congress should require states and metropolitan regions to adopt transportation plans that would achieve net-zero GHG emissions from the surface transportation sector by midcentury. Fourth, the bill should require the secretary to prioritize competitive grant awards for projects that reduce automobile dependence and provide residents with safe, affordable access to opportunity; reduce GHG emissions; and redress harms caused by past highway investments. And fifth, the bill should promote good jobs for residents through targeted, local hiring; registered apprenticeships; and job quality standards such as prevailing wage protections. To highlight the need for policy reform, this report starts by looking at several highway projects built during the peak of the interstate construction era and how they caused inequitable displacement, auto dependence, and barriers to opportunity. The report then profiles two highway projects that are repeating many of the same harms due to federal transportation programs’ lack of accountability and progressive design.
Finally, the report closes with four projects that show how federal funds can support infrastructure that creates inclusive and sustainable prosperity: a bus rapid transit (BRT) line in Birmingham, Alabama; a dedicated biking and walking facility in Los Angeles; a highway-to-boulevard conversion in Detroit; and a passenger rail line along the Front Range in Colorado.
Both the BRT line and the bike and walking facility received federal funding through TIGER, and the two other projects are excellent candidates for federal assistance. The TIGER program—now known as RAISE—was created in 2009 through the American Recovery and Reinvestment Act and demonstrates that recovery spending can serve as a catalyst for reform. It is essential that the federal government target economic stimulus to those projects that will generate the greatest social, economic, and environmental return on investment.
Understanding the past
Federal transportation investments—especially in highways—have often caused significant social, ecological, and economic harm. This transportation history offers powerful lessons that can help policymakers design programs and investments that will empower local communities, provide access to opportunity and essential services, and create a foundation for prosperity in regions facing persistent hardship.
I-375 in Detroit
Black Bottom was once a thriving predominantly Black neighborhood that sat just to the east of Detroit’s central business district. This community was largely demolished to make way for the construction of Interstate 75/375 (I-75/I-375), also known as the Chrysler Freeway, as well as new housing targeted toward more affluent and mostly white residents.5 According to the Detroit Free Press, “Black Bottom’s boundaries were informal, never set down in any legal document, and people differ about the specifics. But the borders were generally described as Gratiot, Brush, St. Aubin or the Grand Trunk rail tracks (now the Dequindre Cut recreation path) and Congress.”6
Detroit’s Black population grew rapidly during the first half of the 20th century, and Black Bottom grew along with it. In 1910, Black residents accounted for roughly 1.6 percent of the city’s population. By 1950, this share had jumped to 16 percent of the city’s more than 1.8 million residents.7 Housing discrimination, including lack of access to credit and race-based restrictive housing covenants, prevented Black residents from living in many parts of the city, but the Black Bottom and nearby Paradise Valley neighborhoods were exceptions.
Unfortunately, the civic and political leadership of Detroit did not value the Black Bottom community. In fact, leaders considered the area a slum. A pamphlet published by Detroit Mayor Edward J. Jeffries Jr. in 1944, titled “Post-War Improvements To Make Your Detroit a Finer City in Which to Live and Work,” proudly proclaimed, “We want decent homes in clean, airy surroundings to replace our slums.”8 City leaders envisioned a modern metropolis with high-rise structures and a vast network of freeways to move cars into and out of downtown. Regardless of the fact that the Black Bottom neighborhood was a growing community, it was seen as a barrier to a modern, postwar age dominated by the personal automobile.
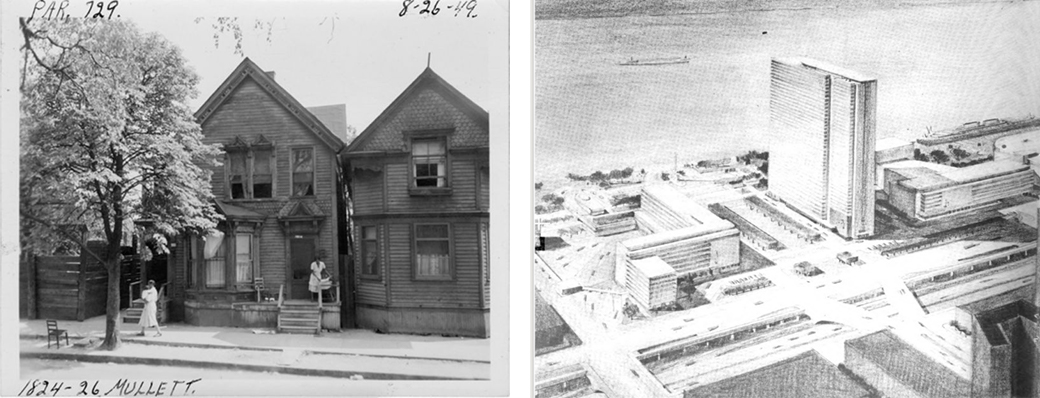
Left: Photo showing a home on Mullett Street in the Black Bottom neighborhood prior to construction of I-375/I-75. Photo courtesy of the Burton Historical Collection of the Detroit Public Library. Right: Rendering of Detroit as envisioned by the city of Detroit for postwar redevelopment. Rendering is courtesy of the University of Michigan via the HathiTrust Digital Library.
The mayor’s pamphlet stated, “Of all the various projects now under consideration, perhaps none is of greater importance to Detroiters than the proposed system of expressways.”9 Roadway modernization is not itself necessarily discriminatory, but it raises an essential question: For whom were the new freeways being built? The simple answer: not the residents of Black Bottom. In fact, the mayor’s pamphlet stated clearly that the goal was not to protect those residents but to make the “Civic Center … readily accessible to outlying sections.”10 In short, the political leadership of Detroit was proclaiming a postwar vision for new housing and highways that was not intended to benefit displaced residents of color. Black Bottom was decimated with little or no compensation to the families who lived there in order to make way for housing and highways that would benefit others.11
It’s also important to note that the destruction of thousands of homes in the Black Bottom and Paradise Valley neighborhoods took place within a broader context of rigid, race-based housing discrimination. For instance, a U.S. Federal Housing Administration practice known as redlining made it nearly impossible for prospective Black buyers to obtain a home mortgage in or near predominantly Black neighborhoods.12 Moving to largely white neighborhoods was also extremely difficult due to restrictive housing covenants that prohibited property owners from renting or selling to Black residents or other people of color.13 Additionally, the city of Detroit and many surrounding municipalities used zoning ordinances to require the construction of single-family homes instead of multifamily apartment buildings in an attempt to keep out lower-income renters. And when Black residents did succeed in moving to other neighborhoods, white flight to new suburban enclaves—facilitated by the very highways that caused the original displacement—soon followed. The pattern of predominantly Black neighborhood destruction to make way for highways intended to speed largely white suburban commuters repeated itself in metropolitan areas across the country.
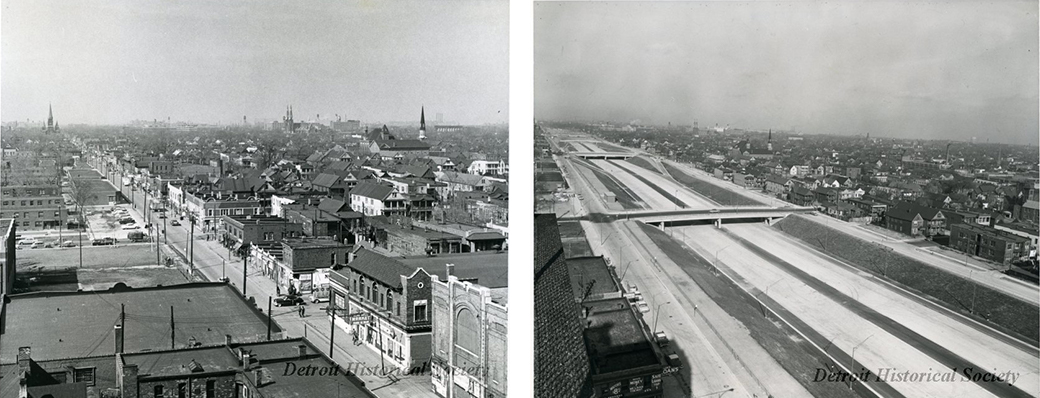
Left: Black Bottom neighborhood in Detroit in 1959 prior to construction of I-375/I-75 Right: Photo of the newly completed I-75. These photos are courtesy of the Detroit Historical Society.
The mayor’s pamphlet takes care to highlight congestion and the cost of lost time for drivers as a central motivation for the city’s freeway plans: “It has been estimated that during 1940, a fairly normal year, traffic congestion cost Detroiters $28,000,000 in lost time, exclusive of accidents.” When adjusted for inflation, this amount translates to $530 million.14 Regardless of the accuracy of the mayor’s estimate, it is clear that the idea of lost time for drivers due to congestion was seen as unacceptable. This point is particularly important because congestion and vehicle delay remain a frequent justification for highway expansion projects to this day.
In 1956, Congress passed the Federal Aid Highway Act, ushering in an era of interstate highway construction. During this period, the federal government covered 90 percent of the cost of building the original interstate highway network.15 However, it left project planning to states and regions—a policy that continues to the present day. Federal dollars helped to turn the glossy plans of elected officials such as Mayor Jeffries into a reality.
I-95 and the MacArthur Causeway in Miami
The predominantly Black neighborhood of Overtown sits to the northwest of the central business district in Miami. Much like Black Bottom, the neighborhood was largely razed to make way for I-95 as well as a massive interchange between I-95 and I-395, which is also known as the MacArthur Causeway. The Overtown community predates the incorporation of the city of Miami and was a “port of entry for black immigrants from Cuba, Barbados, Haiti, Trinidad & Tobago, and Jamaica.”16 The neighborhood’s population peaked around 1950, and it was “a bustling neighborhood, the commercial and social center of Miami’s black community.”17 Yet, by 1965 and as a result of displacement due to highway construction, the population in Overtown had fallen by 75 percent.18 For instance, “Twenty square blocks of Overtown were taken for one interchange alone, displacing some 10,000 people.”19 The Overtown community, which was often called the Harlem of the South, was all but wiped off the map.
Initially, planners had proposed running I-95 roughly parallel to the Florida East Coast Railway corridor, which runs close to the shoreline and into downtown. According to historian Raymond Mohl, “A 1955 plan for the Miami expressway, prepared by the Miami City Planning Department, routed a North-South Expressway along the Florida East Coast Railway corridor into downtown Miami—a route that had little impact on housing in nearby Overtown.”20 This initial plan was soon rejected. But a 1956 plan that was prepared for the Florida State Road Department “shifted the route to the west and directly through Overtown.” Although people in the community voiced their objections to the plan, the department signed off on the new alignment, and city officials, such as members of the Miami Chamber of Commerce, supported its construction.21 The western alignment ensured “ample room of the future expansion for the central business district in a westerly direction.”22
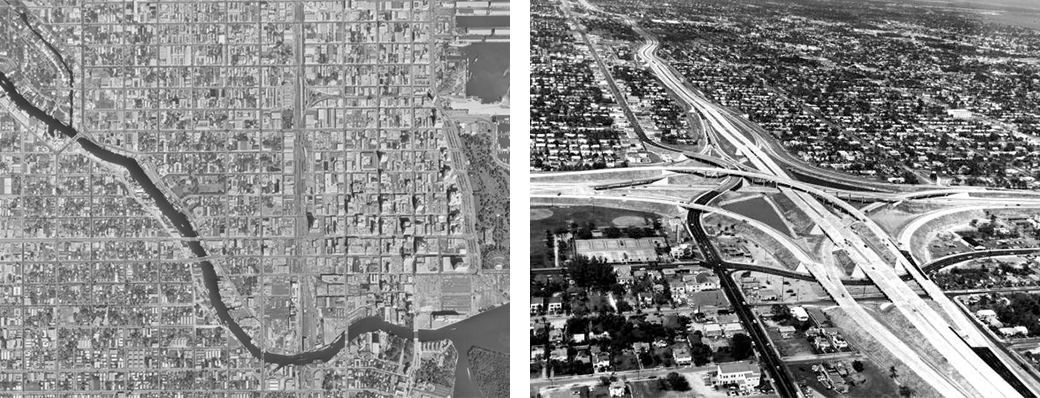
Left: City of Miami prior to I-95 construction. Photo courtesy of the U.S. Geological Survey and the University of Oklahoma Institute for Quality Communities Right: I-95 construction in Overtown, Miami. Photo courtesy of the Florida Department of State, Division of Library and Information Sciences.
The resulting displacement of Black residents was of little concern. In fact, there is good reason to believe that the white establishment saw it as a benefit. During the 1930s, the Dade County Planning Board drew up plans to build new housing on the far western fringe of the region with the intent of relocating all Black residents out of the city of Miami.23 The resettlement pattern was proposed as a model for the nation. I-95 largely accomplished what prior plans had not—pushing Black residents west and providing room for business growth downtown.
Like the I-75/I-375 expressway in Detroit, the construction of I-95 in Miami took place in a disadvantaged community of color but was in no way designed for the benefit of the residents of that community. These major highway projects were principally designed to facilitate faster vehicle speeds and shorter travel times for growing numbers of suburban commuters. Moreover, these highways were designed to spur economic development in central business districts, which tend to support professional service jobs inaccessible to displaced residents—either historically as a result of Jim Crow segregation or de facto segregation that results from the educational disparities that persist to this day.
Repeating the same mistakes
Unfortunately, state transportation departments continue to define mobility success as reducing vehicle delay and ensuring a smooth car commute for suburban residents. The steady flow of federal highway funds distributed through formulas set in law as opposed to local need or merit means that even the most cost-ineffective, unsustainable, and socially destructive projects can advance.
This section profiles two contemporary highway projects that repeat many of the same mistakes of the early years of the interstate construction era. The first project is the North Houston Highway Improvement Project, which will expand I-45 in Houston, causing the loss of numerous businesses and affordable housing units, among other harms. The second project is the Opportunity Corridor in Cleveland, which is intended to save suburban commuters a few minutes on their daily drive without providing any meaningful opportunities to residents of the neighborhood through which the new boulevard will pass.
I-45 in Houston
The North Houston Highway Improvement Project (NHHIP) is an enormous highway expansion project with an estimated price tag of at least $7 billion—though the sheer scale of the project means this 2017 estimate by the Texas Department of Transportation (TxDOT) is almost certainly low.24 The NHHIP would add four managed lanes to I-45 along the roughly 17-mile segment that extends from Beltway 8 to downtown Houston. In addition, the project would expand and make changes to the alignment and operations of multiple freeways that encircle downtown Houston, including I-45, I-10, and U.S. 59/I-69.25 Finally, the project involves the reconstruction of existing interstate lanes along with certain frontage roads and the addition of a few modest nonmotorized elements.
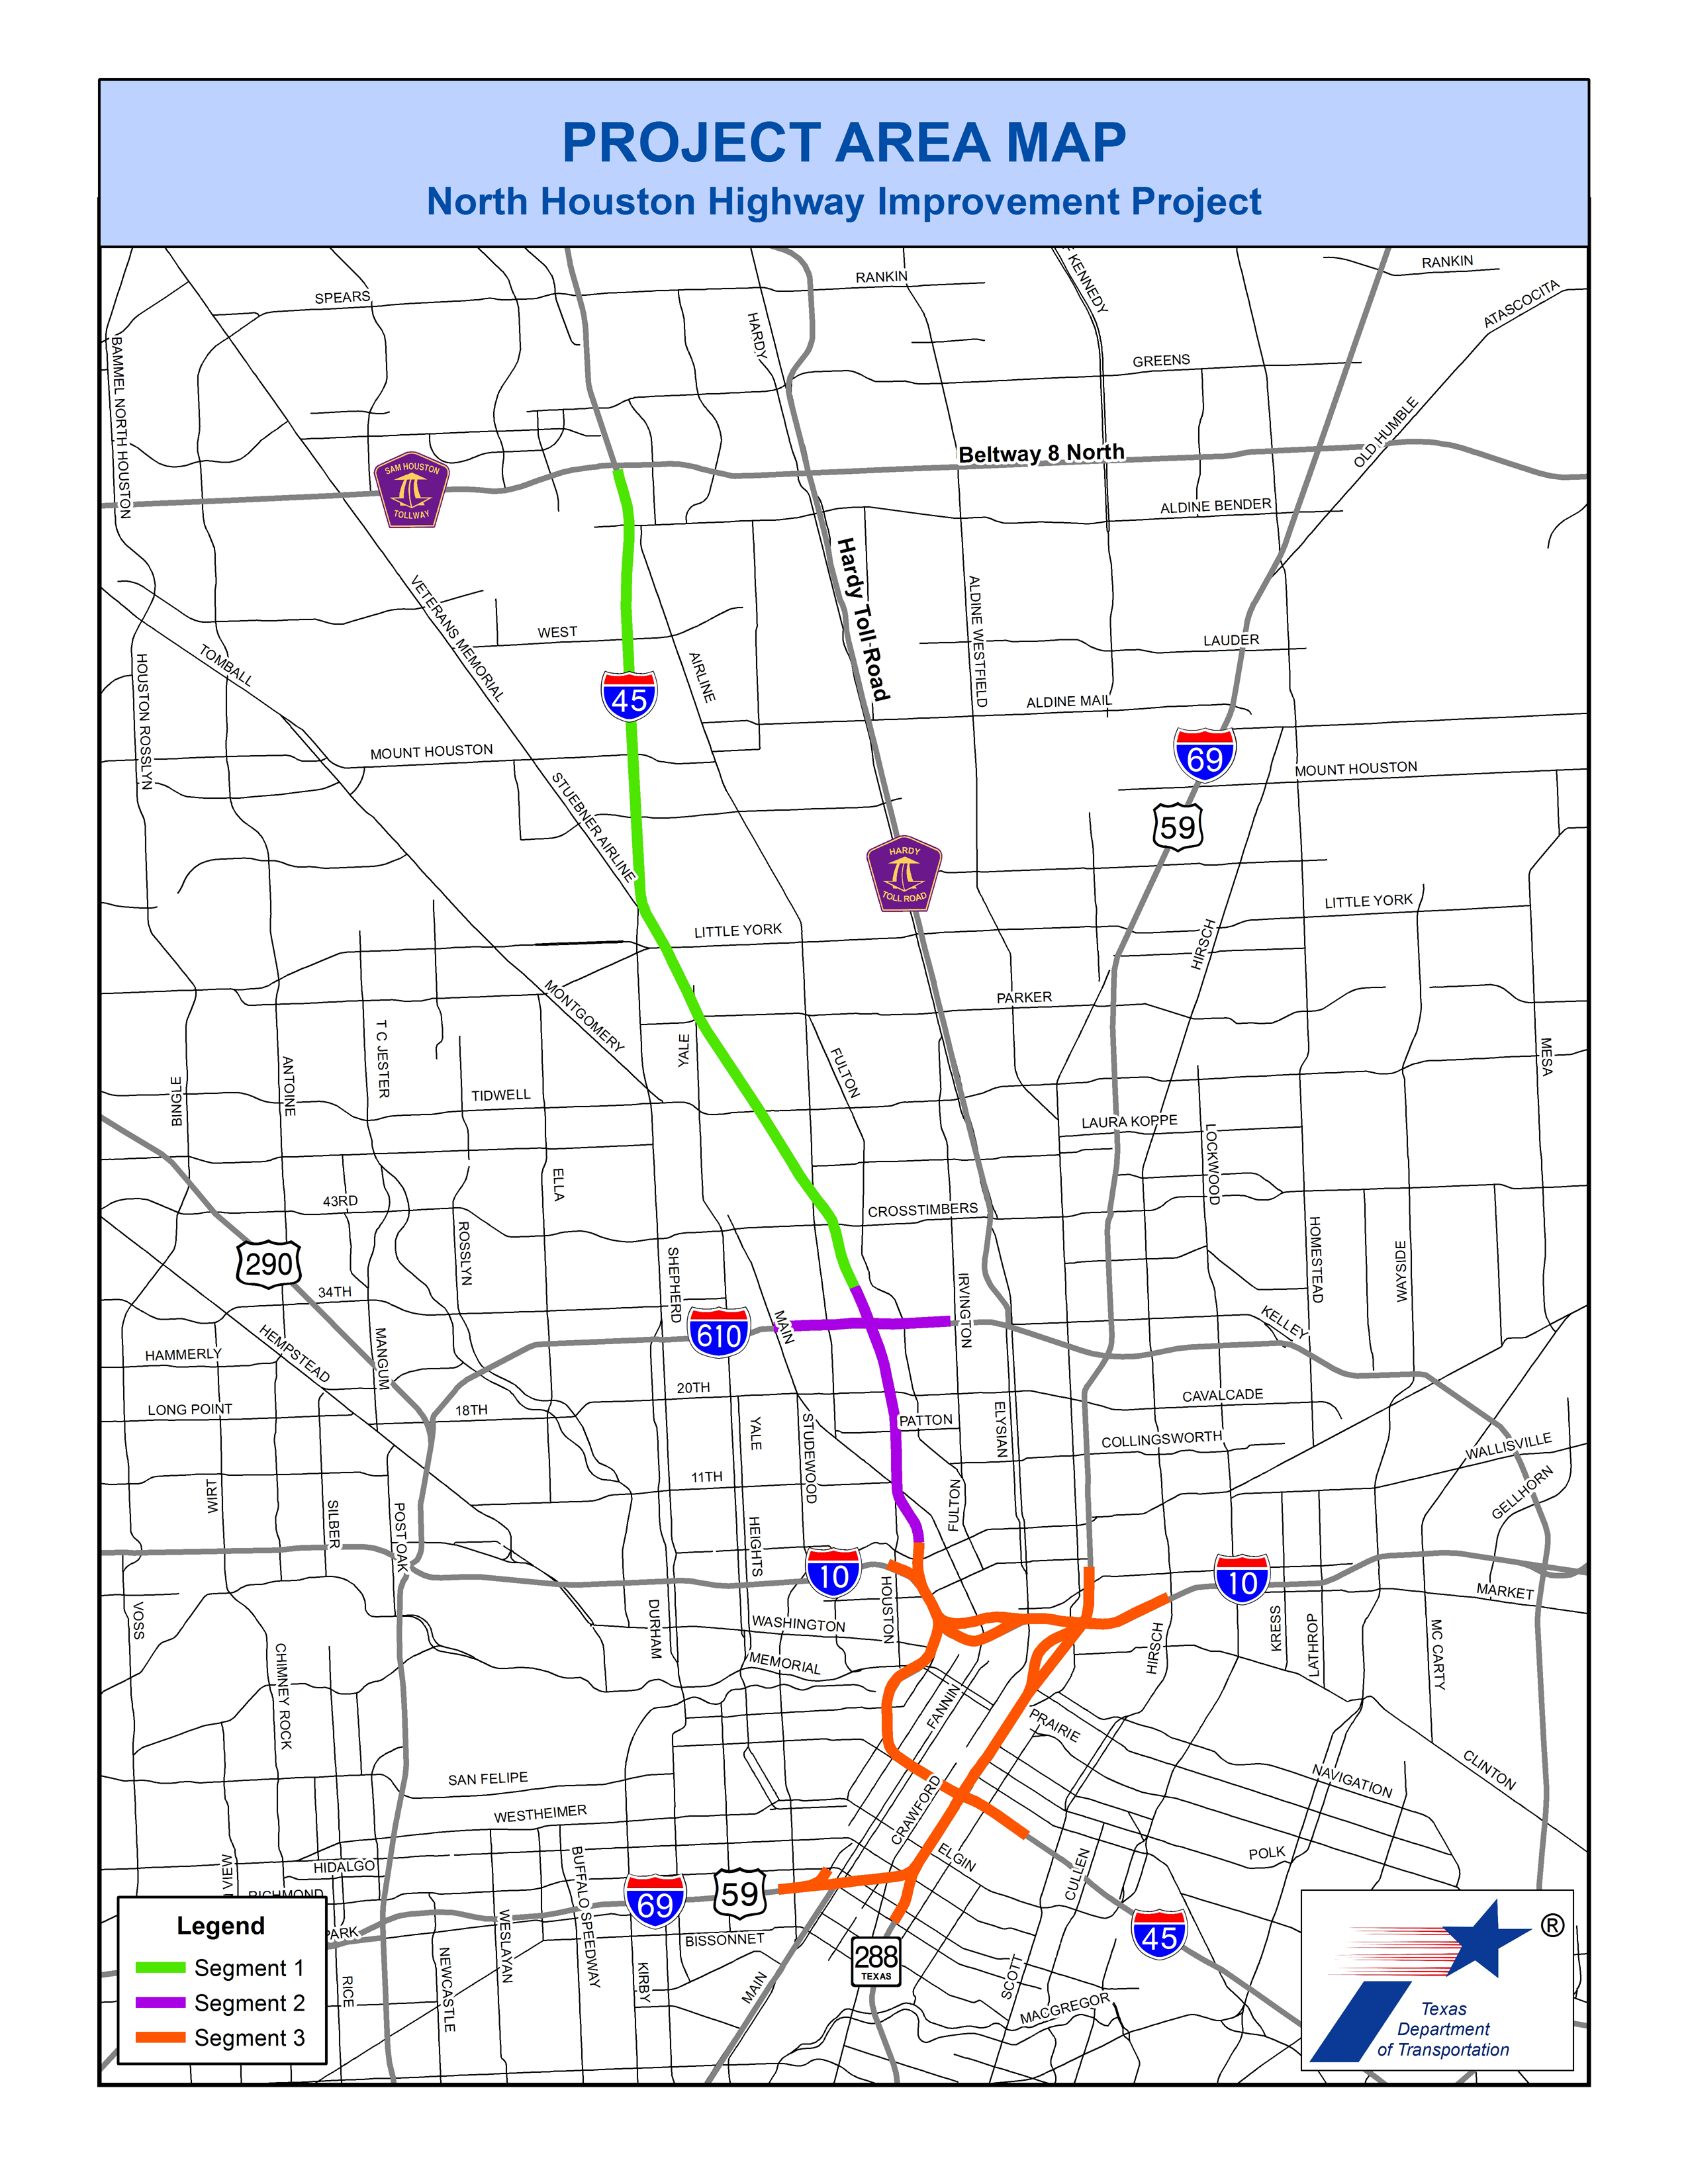
Map of I-45 North Houston Highway Improvement Project. Map courtesy of the Texas Department of Transportation.
TxDOT justifies the undertaking by stating that average daily traffic volumes on I-45 within the area between Beltway 8 and downtown Houston are “projected to increase by approximately 40 percent between 2015 and 2040.”26 The state’s goal for the expansion is to “manage congestion, enhance safety, and improve mobility and operational efficiency on Interstate Highway 45.”27 This rationale appears straightforward at first glance, but upon inspection, it has two major problems.
First, TxDOT presents the growth in vehicular travel demand in 2040 as inevitable rather than an outcome that will result from intentional transportation policy and investment choices. Stated more simply, TxDOT is not responding to the future but creating it. By investing more than $7 billion to expand highway capacity in central Houston, TxDOT is literally building the infrastructure that will reinforce auto-dependent mobility and increased vehicle miles traveled (VMT). This outcome does not have to come to pass. The state has the ability to make different investment choices that would produce less driving, congestion, air pollution, and other negative consequences of highway expansion.
Second, TxDOT is only conceiving of performance in terms of vehicle speeds and operational efficiency. In other words, it is only measuring what happens to cars traveling on the pavement the state lays down. However, as the I-375 project in Detroit—and many other interstate projects in cities around the country—demonstrates, the social, economic, and ecological impacts of major highway construction extend far beyond the boundary of the highway itself. It is unacceptable for a state department of transportation to have such a narrow view of a project’s impact. The state should adopt a broader set of performance measures that reflect the full scope of outcomes affected by major transportation investments. At a minimum, TxDOT should measure how a proposed major highway expansion project would affect public health, land use, household transportation costs, and access to opportunity, among other things.
According to TxDOT, “On average, there are 540 million on-system VMT each day, which is enough to circle the earth nearly 100 times every minute.”28 The NHHIP would only add to this already staggering amount of daily driving. Moreover, building the NHHIP would significantly harm the local community. First, the NHHIP would result in large-scale loss of affordable housing and community businesses. In total, the project would affect 450 acres of land and result in the taking of 160 single-family and 919 multifamily homes, including 486 public or low-income multifamily residences.29 A report on the project by the city of Houston and Harris County notes that “Harris County has a significant shortage of affordable housing and many neighborhoods impacted by the NHHIP project are experiencing rising housing costs and increased displacement.”30
Beyond housing, the project would displace 344 businesses. The report states, “Businesses dependent on local traffic and neighborhood recognition may not be able to find a suitable location nearby to maintain their client base.”31 As for community institutions, the highway expansion project would displace five places of worship and two schools.32 Finally, the project would reduce local property and sales tax collections by between $153 million and $314 million annually due to residential and commercial displacements.33 Stated simply, these are not modest impacts.
The harms from the current design of the NHHIP caused Harris County to file a federal civil lawsuit against TxDOT. For its part, TxDOT has formally responded in federal court by denying the claims asserted by Harris County.34 The lawsuit, which is ongoing, argues that TxDOT adopted a design that “ignored serious harms, disregarded the concerns of the communities impacted by the Project.”35 In addition, the civil action states that TxDOT should “learn from the regions’ past experience that wider freeways cause more traffic, not less,” arguing that the state should put forward a design without “unnecessarily displacing hundreds of families and businesses.”36 The county points out in its filing that “Harris County is a designated serious nonattainment area for the Environmental Protection Agency’s (‘EPA’) 8-hour ozone 2008 standard, and marginal nonattainment area for the EPA’s 8-hour ozone 2015 standard.”37 A nonattainment area is a geographic region that has pollution levels that exceed national ambient air quality standards set by the Clean Air Act.38 Adding lanes to I-45 will only exacerbate the region’s nonattainment status.
The U.S. Federal Highway Administration has asked TxDOT to pause its implementation of the NHHIP because the project raises potential issues tied to Title VI of the Civil Rights Act of 1964 “and related environmental justice concerns.”39 Title VI prohibits federal funds from contributing to discrimination based on race, color, or national origin, including actions that may not be discriminatory in their intent but that produce disparate impacts against protected groups.40 This concern arises with NHHIP due to the extensive loss of businesses and affordable housing units that it would cause in communities of color. In fact, the residents living in the 42 census tracts located in or adjacent to the project are overwhelmingly Black or Hispanic, and many of them are below the poverty line and have limited English proficiency.41
Finally, TxDOT’s environmental review notes, “Urban development trends are not likely to be substantially changed by this project.”42 This is precisely the problem. The state should be looking for investment options that will put the region on a fundamentally sustainable growth and mobility trajectory. Rather than displacing affordable housing and local businesses, the state should be investing transportation funds in projects that reduce emissions, expand transportation options, reinforce community, and reduce pollution burdens, among other harms associated with automobility. Instead, TxDOT is gearing up to make many of the same mistakes that occurred during the early interstate construction era—though on a slightly smaller scale.
The Cleveland Opportunity Corridor
President Biden and Secretary Buttigieg have made a bold and welcome commitment to using federal infrastructure funds to deliver real benefits to historically disadvantaged communities. However, achieving this goal will require more than simply investing federal dollars in a particular geographic area. Truly providing safe and affordable access to economic opportunity while also addressing historic discrimination and disproportionate pollution burdens, among other harms, will require thoughtful project design.
The Opportunity Corridor project in Cleveland, with an estimated cost of $331 million, demonstrates how the language of empowerment can serve as cover for an investment intended to serve traditional suburban commuters rather than city residents.43 This project shows that federal infrastructure spending must be paired with policy changes to avoid such “equity washing” and ensure that investments yield tangible benefits for disadvantaged communities.
The Opportunity Corridor involves the construction of a large urban boulevard that will connect I-490 to the University Circle area, which includes Case Western Reserve University and several large medical facilities.44 The origins of the Opportunity Corridor trace all the way back to the early days of highway planning.
In 1944, the Regional Association of Cleveland released a vision for a system of express highways that would ring downtown and radiate out across the region much like the hub and spoke of a wheel. Today, the interstate highway network in the greater Cleveland area closely resembles this original vision. The only missing elements are highway connections to the University Circle area. Whereas the original plan called for highway access to University Circle from the north, west, and south, the current system provides access just from the north with U.S. 20 and the west with Euclid and Chester avenues.
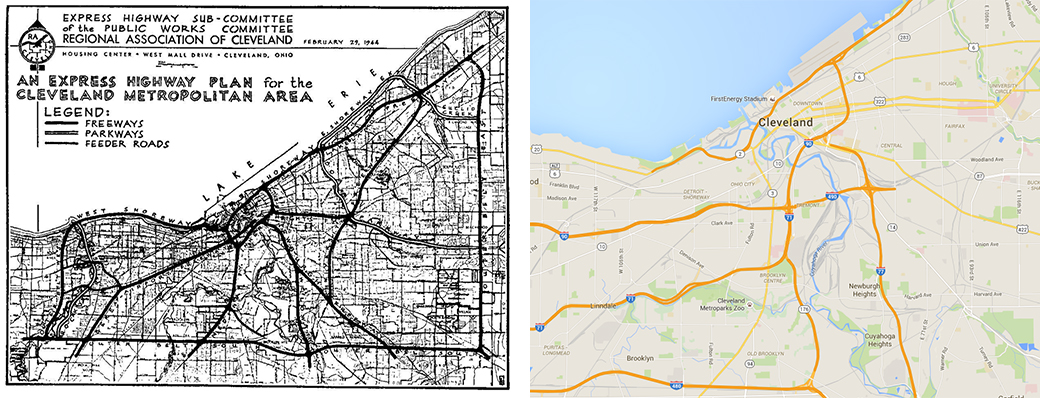
Left: Express highway system concept map of Cleveland in 1944. Map courtesy of Roadfan. Right: Map of Cleveland highways. Map courtesy of Google.
In the roughly 70 years since the association released its vision, however, a great deal has changed in the Cleveland area. For starters, the city of Cleveland has far fewer people. From 1950 to 2019, the city’s population fell by more than 533,000 people—58 percent.45 (see Table 1) Census data reveal that a portion of city residents relocated to other parts of Cuyahoga County while many others migrated to the counties that surround Cuyahoga County. Overall, the metropolitan region has added 978,000 people in total since 1950. This translates to an annual growth rate of only five-tenths of 1 percent.46
Table 1
In effect, the region has experienced the same trend of large-scale urban flight and suburbanization as many other areas of the country—especially the industrial Midwest. This has placed added demand on the region’s highway network as commuters rely increasingly on highways to cover longer travel distances to reach major job centers. The most heavily used section of highway in the region is I-90, also known as the Innerbelt, which wraps around downtown Cleveland to the south and east. Each day, the Innerbelt carries approximately 150,000 vehicles.47 It plays a crucial role in the regional highway network, collecting traffic from the radial freeways—I-71 and I-77—during the morning peak period and then distributing this traffic to the local street grid. In the evening, the Innerbelt works in reverse, collecting traffic from local streets and distributing it to the radial freeways.48
In 2004, after years of study, the Ohio Department of Transportation (ODOT) released the Innerbelt Strategic Plan, which called for a major reconstruction and modernization of the Innerbelt.49 In addition to replacing deteriorating infrastructure, the Innerbelt reconstruction is intended to improve the overall performance of I-90 by eliminating design deficiencies—such as tight curves, steep ramps, and the absence of a shoulder for broken-down vehicles—that slow traffic and increase congestion. Work on the modernization began in 2011 and is ongoing.50 Yet, even with an improved design, the Innerbelt still faces substantial congestion during the morning and evening peak periods. This pushed ODOT to look for ways to siphon off traffic from the Innerbelt. Enter the Opportunity Corridor:
As part of the Innerbelt Strategic Plan (July 2004), concepts were also developed to shift some traffic from the Innerbelt Bridge to other roads. One specific concept was to provide a better transportation connection between I-490 and University Circle. Both freeway and boulevard connections were studied, but the freeway alternative was not recommended due to costs, estimated property impacts and public opposition.51
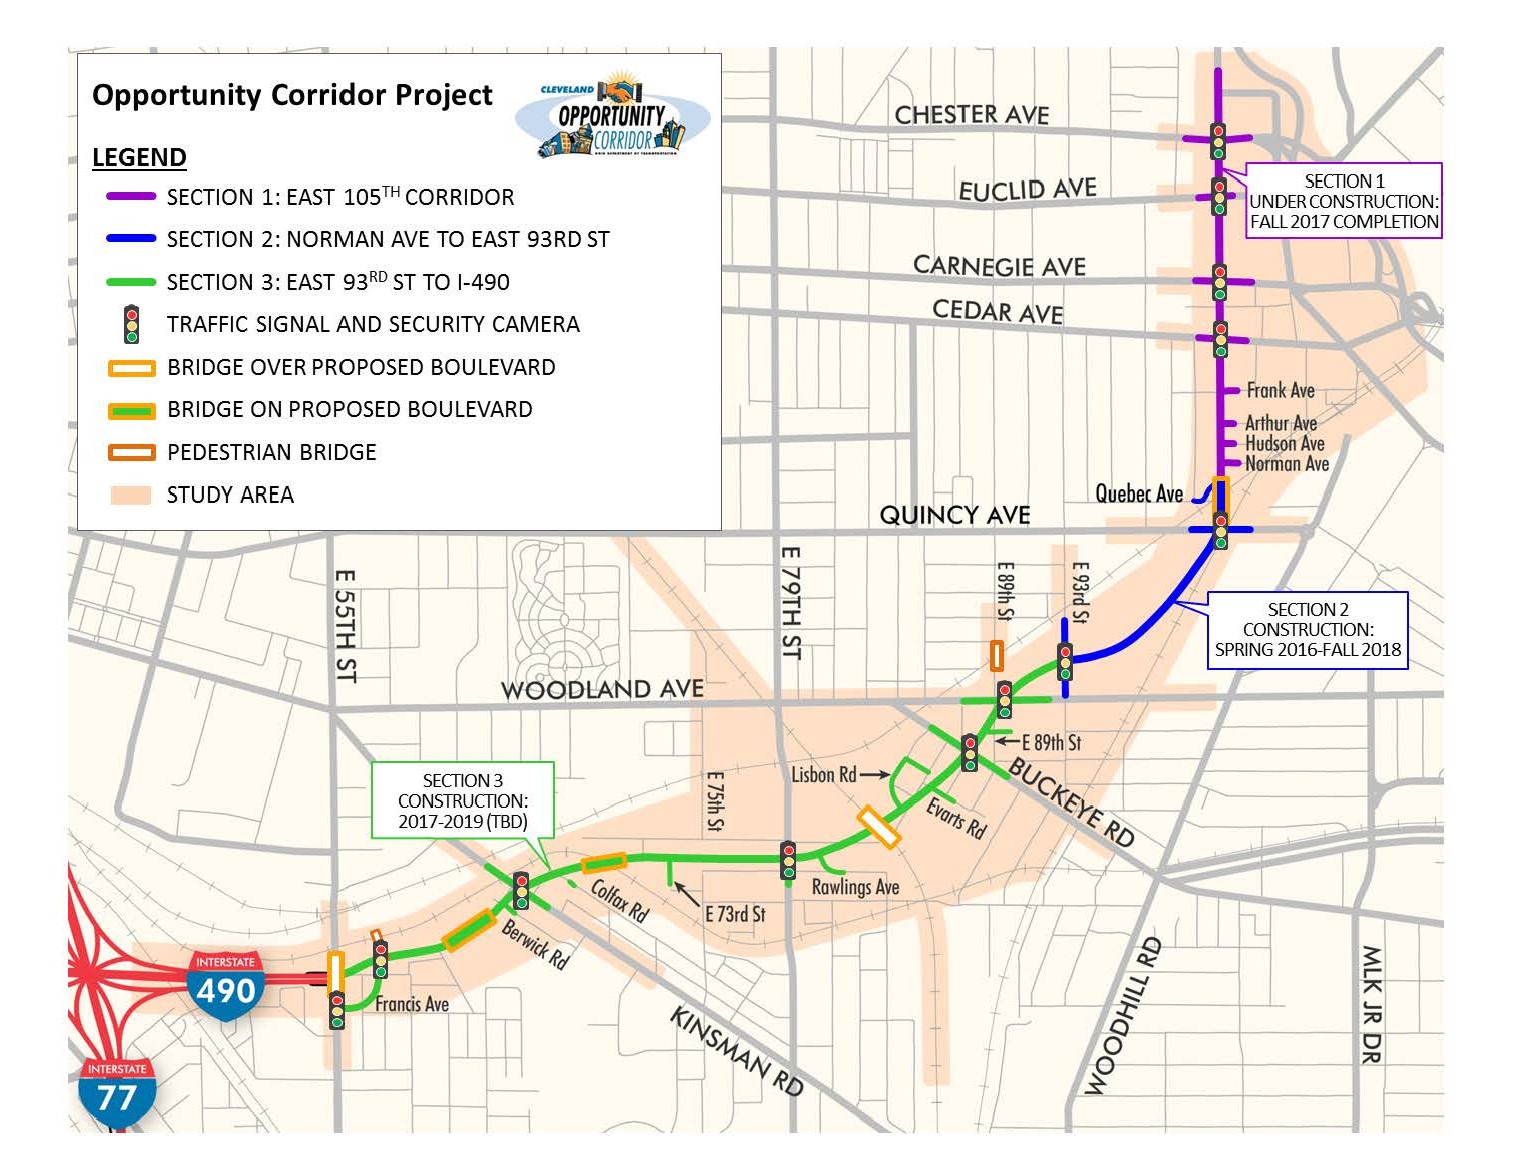
Map of the Opportunity Corridor in Cleveland. Rendering courtesy of the Ohio Department of Transportation.
The University Circle area is a major employment center, drawing workers from all over the region.52 Currently, workers commuting into the University Circle area from western Cuyahoga, Lorain, Medina, and Summit counties must take one of the radial freeways, then merge onto the Innerbelt and take either Prospect, Euclid, or Chester avenues east. The Opportunity Corridor would allow some commuters entering the city from the west and south to avoid the Innerbelt by providing another access road to University Circle. Thus, ODOT intends to spend $331 million to shave a few minutes off the drive time of suburban commuters and relieve a bit of congestion along I-90.
The emergence of the Opportunity Corridor is troubling because two of the original goals of the Innerbelt strategic plan were to “[i]mprove access to industrial and employment areas without routing traffic through neighborhoods” and “[r]educe use of local streets as freeway bypasses.”53 Apparently, these goals fell by the wayside when it came to the neighborhoods affected by the Opportunity Corridor.
The focus on improved performance for the Innerbelt raises an important question: Will spending millions of dollars on the boulevard provide long-term congestion relief for I-90? History strongly suggests that the answer is no, due to induced demand—a well-researched phenomenon in transportation planning. Because driving is not a fixed quantity, the addition of new roadway capacity is quickly filled with either new trips or trips that would have taken a different route or occurred at a different time of day, effectively wiping out the projected congestion reduction benefits in a short period of time.54 In the late 1980s, ODOT embarked on the construction of I-490, an east-west linkage between I-71 and I-77 that ran through the Tremont neighborhood. In 1991, the link opened and briefly provided some relief. However, by ODOT’s own admission, “The decrease in traffic on the Innerbelt following the opening of I-490 was short lived.”55
The shortcomings don’t stop there. The Opportunity Corridor will become a fiscal burden for the already cash-strapped city of Cleveland. According to project documents, ODOT will build the roadway, but the city of Cleveland will be responsible for its long-term maintenance.56 This is no small obligation for a city that is facing a pandemic-induced budget shortfall and declining state support.57 The budget shortfall comes in addition to a larger structural decline in property tax collections due to increased vacancy rates. According to The Plain Dealer, back in 2015, “Property tax collections have declined on account of vacancy and challenges to recent property tax appraisals. And deep cuts to the state’s local government fund continue to affect the city’s bottom line.”58
While the Opportunity Corridor is transparently intended to benefit suburban commuters, ODOT attempts to justify the project on the grounds that it will serve the needs of an economically distressed part of the city. ODOT has stated, “The purpose of the project is to improve the roadway network within a historically underserved, economically depressed area in the City of Cleveland.”59 This assertion deserves skepticism and scrutiny. For starters, according to ODOT, the initial plan for the corridor was a limited-access highway. Specifically, planners wanted to extend I-490 into the heart of University Circle. With cost as a limiting factor, the state downgraded to a boulevard concept.
In addition, ODOT states that two additional goals of the project are to improve “system linkage” and “mobility.”60 To the average person, these seem like somewhat generic goals. After all, roads make linkages and provide mobility. To traffic engineers, however, these goals have a very specific meaning that reveals the true purpose of the project. In this case, the system linkage goal is a reference to creating a bypass for suburban commuters that would reduce demand on the Innerbelt, while mobility is another term for speed.61 When translated into more common language, the Opportunity Corridor is a bypass project intended to provide a high-speed connection to University Circle—neither of which have anything to do with uplifting the struggling neighborhoods along the boulevard.
Education and vehicle access data provided by the U.S. Census Bureau reveal the extent to which the Opportunity Corridor fails to meet the needs of local residents. For example, 42 percent of the households located in census block groups within a half-mile of the new boulevard (roughly the Fairfax, Kinsman, and University Circle neighborhoods) do not have a car.62 To put this percentage in perspective, it’s more than four times higher than the share of households without a vehicle in the entire metropolitan statistical area.63 It’s hard to envision how a road will provide opportunity for households that lack access to a car.
Similarly, the new boulevard will connect with the University Circle employment center, which skews heavily toward education, medical, and management jobs that require a bachelor’s or an advanced degree. However, the educational attainment of residents along the corridor is low. In fact, 23 percent of the population age 25 and older lacks a high school diploma—more than twice the rate of the entire metropolitan region.64
The Opportunity Corridor is about providing a faster commute to suburban residents who live west of Cleveland and work in the University Circle area. No amount of glossy empowerment rhetoric can obscure this fact. For policymakers designing federal infrastructure expenditures to build back better, the Opportunity Corridor offers an important lesson on the difference between building in and building for the benefit of a particular community.
Fortunately, there are many examples of well-designed transportation projects intended to build inclusive economic prosperity, provide substantive access to opportunity, and place the U.S. transportation system on a path to sustainability.
Building for equity and sustainability
In 2009, Congress approved the American Recovery and Reinvestment Act to provide an economic stimulus in response to the Great Recession. The legislation included funding for the TIGER grant program, which allocated money for surface transportation projects through a competitive selection process. The TIGER program has funded many great projects that advance both sustainability and equity in addition to overall economic recovery. TIGER is an example of how a stimulus program can use a discretionary selection process to direct dollars to projects that will deliver on equity, inclusive prosperity, and sustainability. The TIGER program—now known as RAISE—has been so successful that Congress continues to appropriate money to it.
Birmingham Xpress
In 2015, the U.S. Department of Transportation awarded the city of Birmingham $20 million through TIGER to construct a world-class bus rapid transit line called the Birmingham Xpress.65 According to the city, the purpose of the BRT line is “to connect communities to opportunities and enable Birmingham’s residents, especially low-income citizens and public-transit dependent citizens, to reach employment, educational opportunities, healthcare, and community services.”66
The BRT line will run for 10 miles and connect 25 neighborhoods to essential services as well as major employers, including the University of Alabama at Birmingham (UAB), Regions Financial Corp., St. Vincent Health System, and UAB Health Services, among others.67 Within the service corridor, the city estimates that there are roughly 125,000 jobs, more than half of which are with major regional employers.68 The city also estimates that 21 percent of the local population—roughly 48,000 residents—reside within half a mile of the line.69 Roughly one-third of these are low-income residents, and more than 70 percent are people of color, while 22 percent lack access to an automobile.70
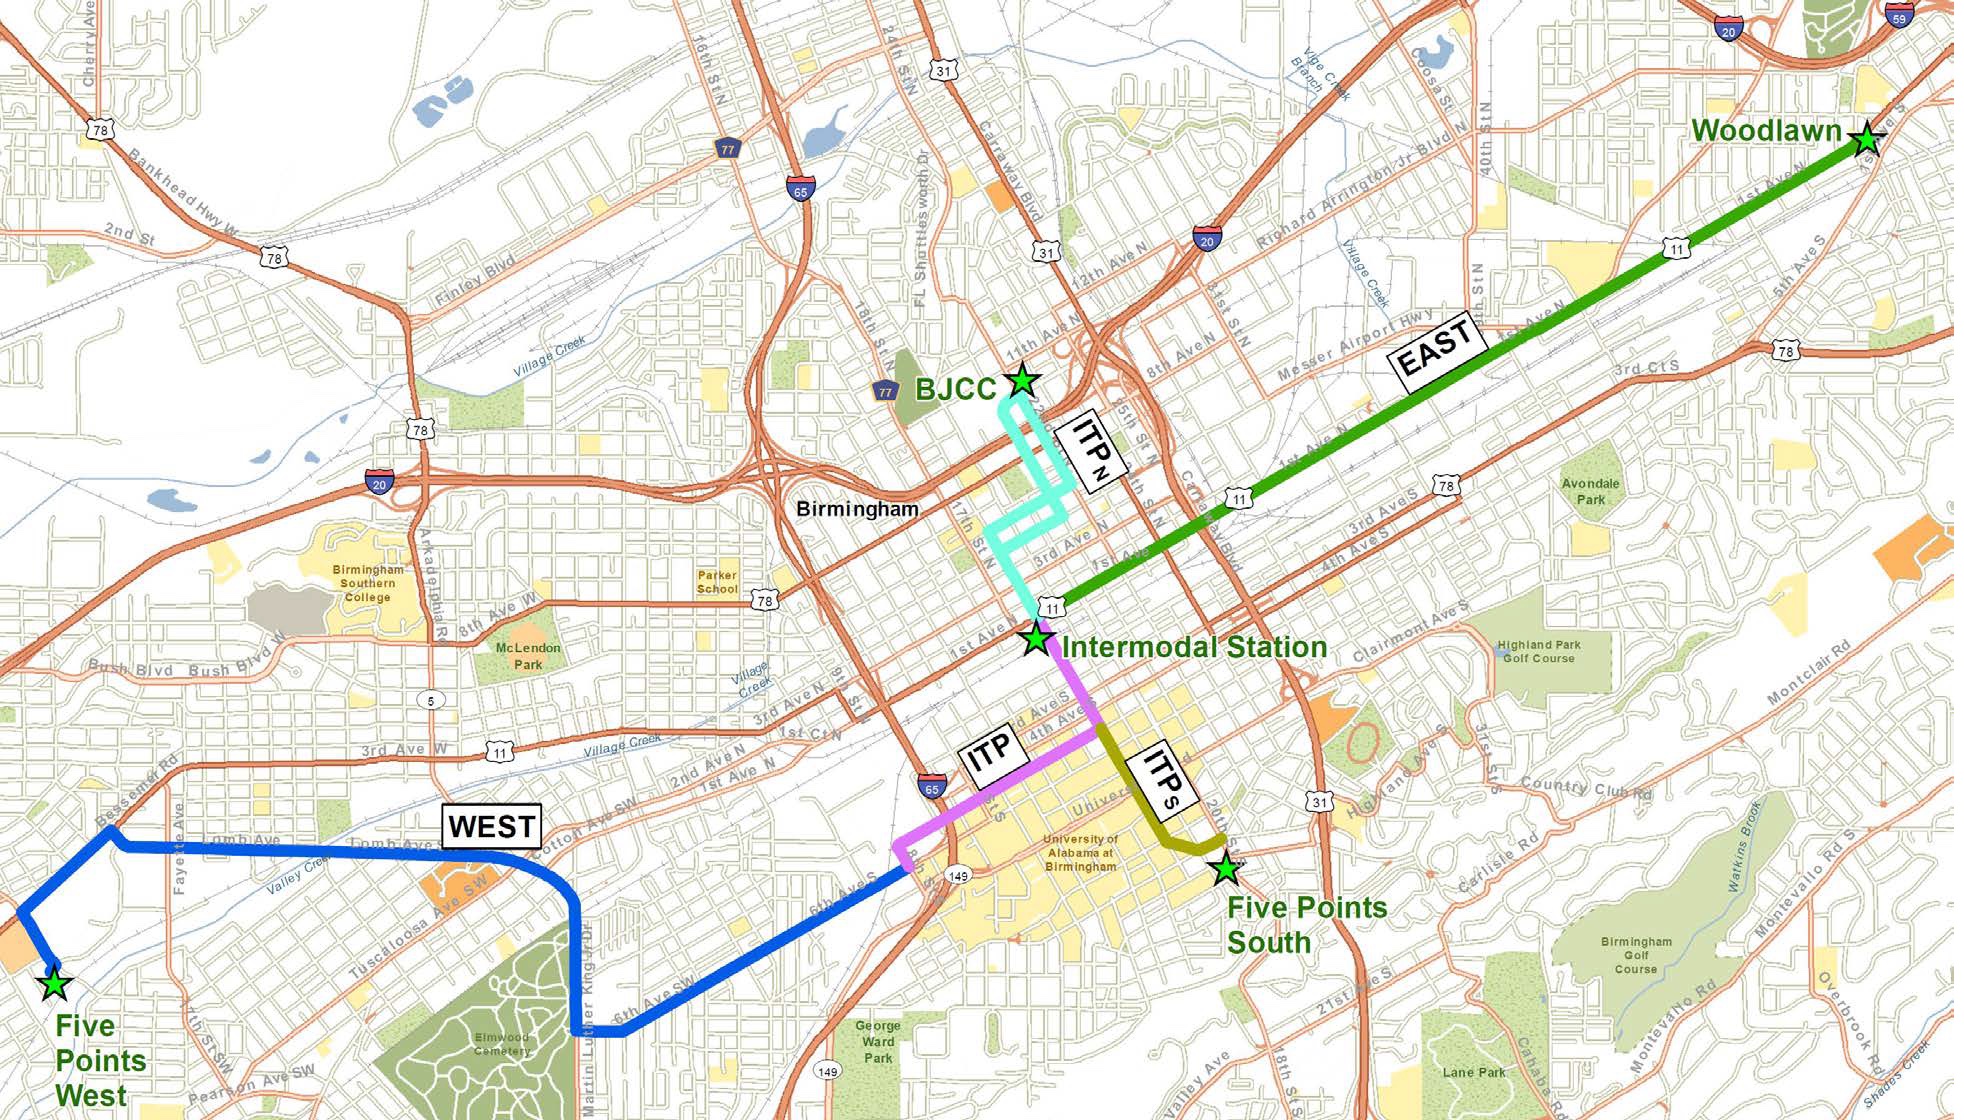
Birmingham Express bus rapid transit corridor. Map courtesy of the city of Birmingham.
In fact, the number of households within the BRT service corridor “living below poverty is twice that of the metropolitan planning area, nearly twice that of Jefferson County, and approximately 12 % greater than that of the BJCTA [Birmingham-Jefferson County Transit Authority] service area.”71 The BRT will also provide more frequent service with a wait time of 10 to 15 minutes between buses during the morning and evening peak travel periods and 20 to 30 minutes during off-peak periods. This service profile is roughly twice as frequent as the standard service offered by the Birmingham-Jefferson County Transit Authority.
The Xpress rapid bus line is also notable because of its limited footprint. Because the line repurposes existing public roadways, construction of the project will require very minimal property acquisition. For instance, none of the 34 bus stops on the line will require any property acquisition or new right of way. At most, the project will require the acquisition of 1.8 acres of private property to accommodate the two community transit centers that are part of the overall project. Importantly, none of these properties currently have “residential occupants.”72 In addition, as part of the project study process focused on social and environmental justice issues, the city determined, “There would be no disproportionately high and adverse human health or environmental effects on minority and low-income population.”73
The Xpress rapid bus project stands in stark contrast to the large-scale social dislocation and destruction of housing and businesses that accompanied the highway construction era of the 20th century and that unfortunately continue to this day. The BRT project will provide safe, affordable, and convenient mobility options for local residents, reducing household transportation costs, promoting access to opportunity, and reducing GHG emissions. In short, the BRT project will provide high-quality service that supports social, economic, and sustainability goals.
Dedicated walking and biking facility in Los Angeles
Los Angeles is a major metropolitan area with heavy congestion and long-standing air quality problems. According to the U.S. Environmental Protection Agency, Los Angeles County is in nonattainment for air quality standards for ozone, lead, and fine particulate matter.74
In 2008 and again in 2016, voters in Los Angeles County overwhelmingly approved ballot Measure R75 and Measure M, respectively.76 These measures raised local sales taxes to support the expansion of public transportation, including new light rail lines, bus lines, and fair subsidies, among other regional transportation improvements.
The multidecade and multibillion-dollar transit build-out approved by voters envisions Los Angeles County becoming far more multimodal and less auto-dependent. Yet achieving this vision will require infrastructure upgrades beyond simply building new rail and bus lines. The region will also need to make many system operational changes—such as prioritizing buses and light rail trains when timing traffic signals—as well as infrastructure investments to support pedestrians and cyclists. After all, most transit riders are pedestrians or cyclists at the start and end of every journey.
Yet the surface transportation systems in Los Angeles—and indeed most of the country—is designed to support automobility. The result is a system that is often hostile and dangerous for nonmotorized users, creating barriers to widespread adoption of transit for daily mobility needs. In recognition of this substantial challenge, the Los Angeles County Metropolitan Transportation Authority (LA Metro) adopted the First Last Mile Strategic Plan in April 2014 “to facilitate easy, safe, and efficient access to the Metro system.”77
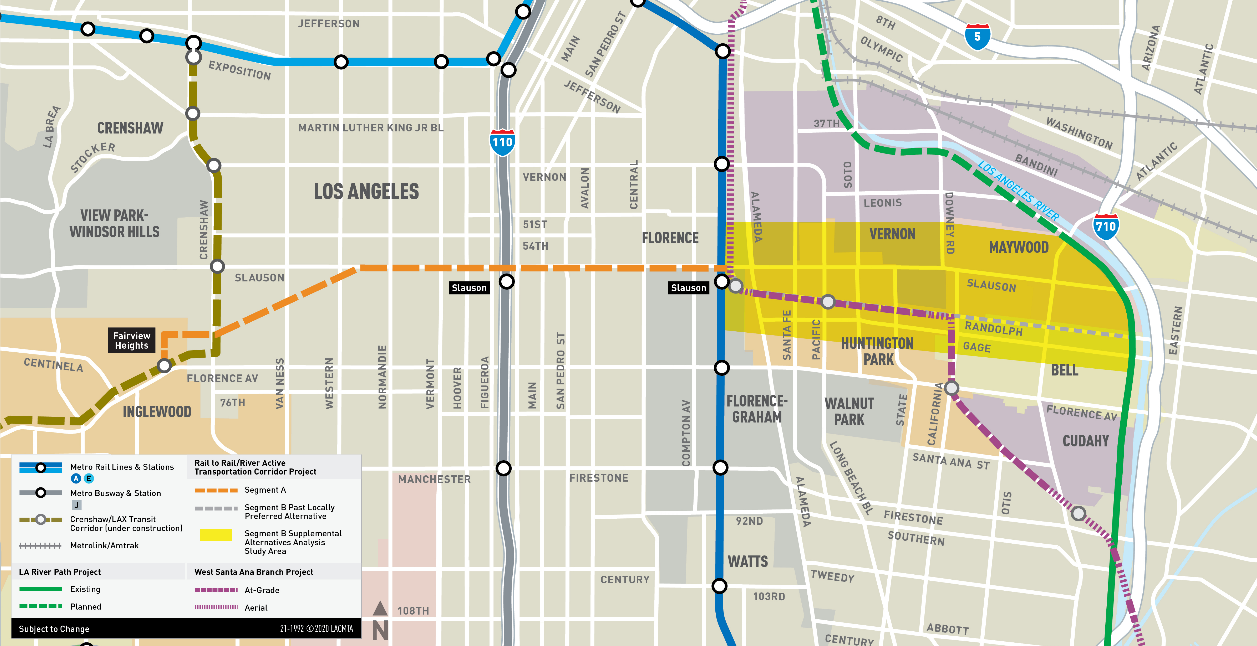
Rail-to-River project map. Map courtesy of LA Metro.
Rendering of bike and pedestrian path. Rendering courtesy of LA Metro.
Ensuring safe access to transit service for nonmotorized users is not a trivial issue. A 2011 rider survey conducted by LA Metro determined that only 9 percent of light rail riders drove to a train station; the other 91 percent walked, biked, or transferred from a local bus.78 Moreover, half of Metro riders were transit-dependent, meaning they lived in a household without a car.79 Improving the safety and accessibility of LA Metro transit service is therefore a way to advance social equity.
Expanding transit use by making it safer and more accessible is also essential to meeting the region’s mobility, air quality, and climate goals.80 For instance, an LA Metro analysis estimates that the average single-occupant vehicle trip emits 3,600 grams of carbon dioxide (CO2).81 By comparison, an individual making the same trip with a bicycle to link to a light rail train emits just 170 grams of CO2—a roughly twenty-fold reduction in GHG emissions.82
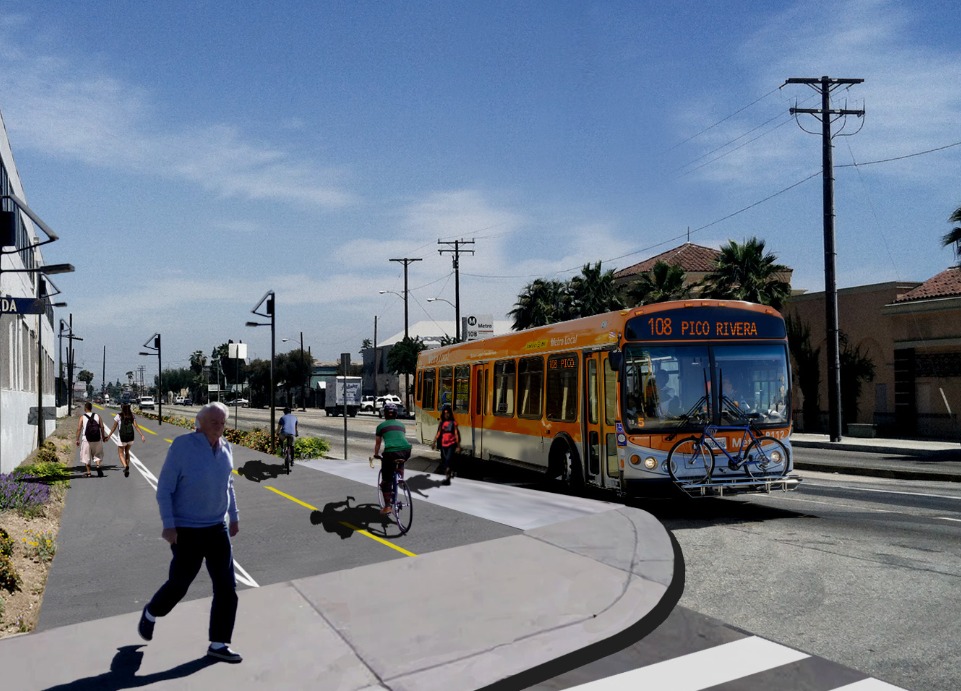
As part of the regional effort to advance first- and last-mile safety and accessibility, LA Metro is implementing a project known as the Rail-to-Rail/River Active Transportation Corridor. Once completed, this project will provide 8.3 miles of dedicated and safe pedestrian and cycling infrastructure principally along Slauson Avenue, which runs east-west through South Los Angeles. The first phase of the facility—called Segment A—will connect travelers to three Metro transit lines: Crenshaw/LAX (light rail), the J Line (BRT), and the A Line (light rail).83 Metro received a $15 million TIGER grant award in 2015 to complete Segment A and is still assembling funds for Segment B, which will run from the A Line light rail station to the southeast along Randolph Street, terminating at the Los Angeles River.84
Completing Segment B will not only provide safe nonmotorized access to the Los Angeles River but also support the future West Santa Ana Branch light rail service. Metro is currently planning to extend light rail service from Union Station in downtown Los Angeles to the southeast, terminating in Cerritos, California. A portion of this West Santa Ana Branch would run along Randolph Street. And while building Segment B along Randolph will likely be more expensive and complex than other options for connecting nonmotorized users to the Los Angeles River, LA Metro has smartly chosen this corridor as the preferred alternative due to its ability to reinforce and support transit use once the West Santa Ana Branch begins service.85
Segment B—as well as the West Santa Ana Branch light rail project—is exactly the type of project that a major economic stimulus package focused on sustainable infrastructure should support. The project would advance safe first- and last-mile nonmotorized access to transit and other amenities such as the Los Angeles River while also furthering regional and national climate, air quality, mobility, and equity goals, among others. Voters in Los Angeles County have shown a strong commitment to advancing a sustainable, multimodal transportation system with the passage of multiple local option sales taxes in recent years. The federal government can serve as a partner by supporting this local commitment with recovery funds.
The I-375 boulevard conversion in Detroit
The Birmingham Xpress and Los Angeles active transportation corridor demonstrate how stimulus grant programs can support equitable and sustainable projects. The next examples, from Detroit and Colorado, are good candidates for similar federal investment.
I-375 has come to the end of its useful life, opening up an opportunity for the Michigan Department of Transportation (MDOT) to redress some of the harms caused by its initial construction. MDOT has conducted an environmental assessment of several alternatives that would replace the huge grade-separated interstate segment with an at-grade boulevard, reconnecting downtown Detroit with what is now known as the Lafayette Park neighborhood. And while converting the highway cannot undo the enormous social damage and dislocation produced by the construction of I-375, it would be a powerful first step toward a more sustainable and equitable transportation system that delivers benefits beyond shaving a few minutes off the commute times of suburban residents.
The I-375 boulevard conversion is an ideal project for the federal government to fund through a future economic stimulus and jobs package focused largely on infrastructure. The boulevard project would advance Detroit’s land use, mobility, and economic development plans for the central business district and areas to the east. Moreover, funding the conversion would send a powerful signal that the federal government recognizes the role it played in undermining the social and economic fabric of urban areas in the mid-20th century.
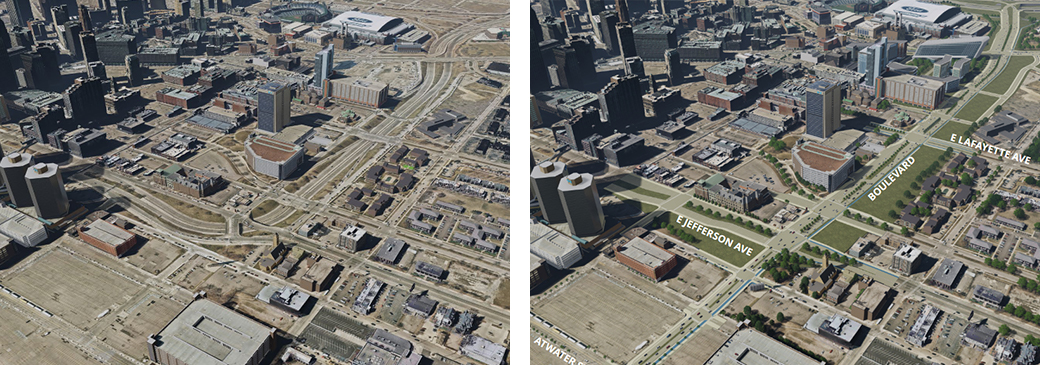
Left: The existing I-375 corridor. Photo courtesy of the Michigan Department of Transportation. Right: Rendering of proposed boulevard conversion project. Rendering courtesy of the Michigan Department of Transportation.
The environmental assessment conducted by MDOT for the I-375 boulevard conversion recognizes the interstate segment is underutilized. According to the MDOT, “I-375 was built at a time when there were more people working and living within downtown Detroit. By the year 2040, employment and population are still not expected to reach the levels achieved in 1950. Many of the roadways, including I-375, have excess capacity and do not experience a lot of congestion.”86 The irony, of course, is that the interstate itself and the accompanying urban renewal of Black Bottom into Lafayette Park is a major reason why population and employment in the downtown area are so much lower.
Regardless, MDOT finds, “The I-375 freeway and I-75/I-375 Interchange create a lack of connectivity for vehicles and pedestrians between the CBD [central business district], Greektown, stadiums, Eastern Market, the neighborhoods to the east, and the Detroit Riverfront.”87 This is dry engineering speak for stating that I-375 is a massive trench that forms a significant barrier that makes building community nearly impossible. In addition, “The undesirable transit and nonmotorized environments along I-375 and Jefferson Avenue corridors include long pedestrian crossing distances, lack of bicycle facilities, poor connectivity to existing transit services, and noise and speed of freeway traffic.”88 In short, establishing a built environment that is right-sized to actual demand, connects downtown to the surrounding areas, and supports sustainable and affordable transportation options requires MDOT to replace the grade-separated highway with an integrated boulevard design.
However, even when planning an interstate-to-boulevard conversion, the performance metrics of vehicle speeds and travel time dominate. A traffic analysis conducted by MDOT indicates that travel times for trips along the boulevard as well as trips on I-75 in the vicinity of the conversion project will increase only modestly. This traffic analysis is standard engineering practice, but it reflects the difficulty that transportation planning has in coming to terms with the fact that a boulevard’s purpose is not to increase speed and reduce travel times, but rather to facilitate greater access by all road users and to support land uses that are human-scaled places for living. If high vehicle speeds and short travel times had been a magic elixir spurring economic development, then the original I-375 would have been a smashing success; it wasn’t. Transportation projects are a reflection of values. The I-75/I-375 project valued moving vehicles at high speeds without regard for the surrounding community. Central Detroit became an island surrounded on all sides by highways. The boulevard project would create livable space and mobility for all users, valuing people and place over speed.
State departments of transportation and the federal government need to adopt progressive performance metrics that reflect desired social, economic, and environmental outcomes from transportation infrastructure investments. The paradigm of vehicle speed must be replaced with a broader set of measures that align with progressive goals.
Colorado’s Front Range
Colorado’s Front Range is situated along the eastern foothills of the southern Rocky Mountains. The corridor is home to roughly 85 percent of Colorado’s population and more than 90 percent of its jobs.89 The Front Range includes the cities of Fort Collins, Denver, Colorado Springs, and Pueblo, among others. I-25 serves as the principal north-south arterial highway. The facility is frequently congested, and travel delays are expected to increase substantially in the coming years with rising travel demand due to population growth and economic development. In fact, by 2045, the population along the Front Range is expected to grow by 35 percent to 6.6 million people.90
In 2017, the Colorado General Assembly established the Southwest Chief and Front Range Passenger Rail Commission to facilitate the “implementation and operation of future passenger rail along the Front Range and Interstate 25.”91 Since 2015, the Colorado Department of Transportation (CDOT) has operated an intercity bus service known as Bustang along the Front Range and to other cities. Prior to the coronavirus pandemic, the Bustang service had a ridership of roughly 250,000 people each year.92 While important, the Bustang service is insufficient to cope with future growth.
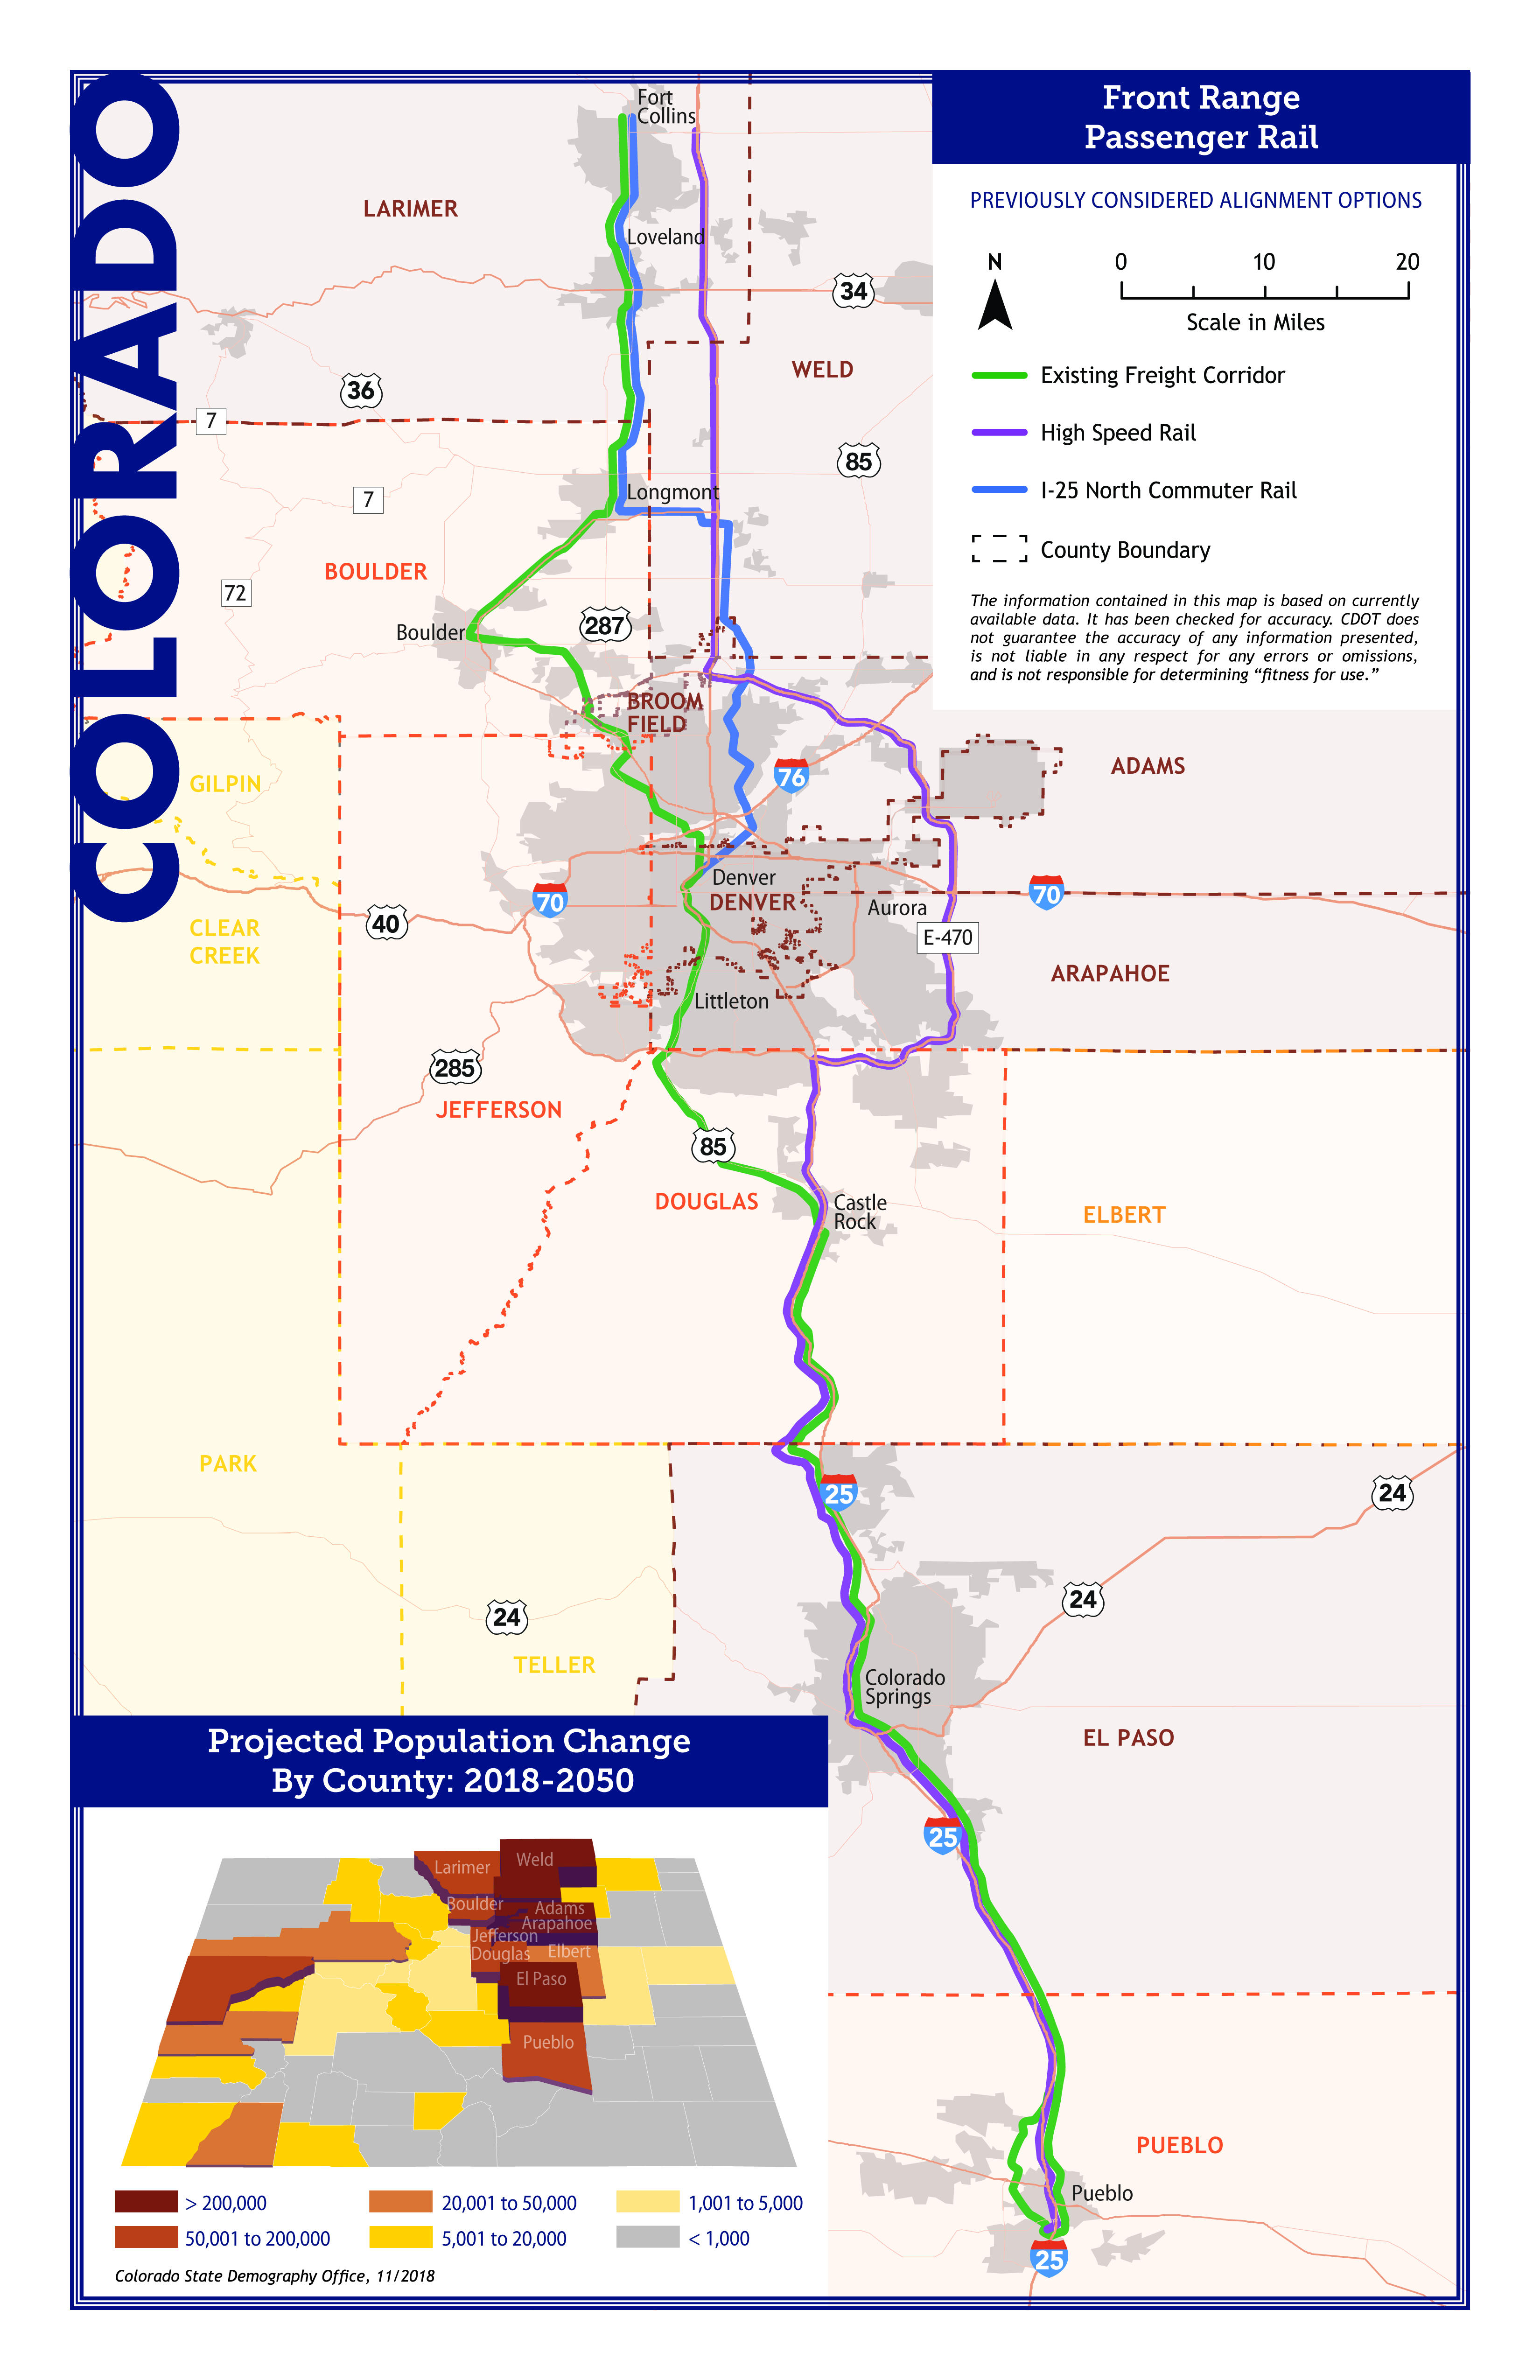
Prospective Front Range passenger rail map. Map courtesy of the Colorado Department of Transportation.
CDOT sees frequent, high-quality intercity passenger rail service along the I-25 corridor as essential to sustainably accommodating anticipated population growth. The linear population distribution along Colorado’s Front Range is ideal for passenger rail service. The ultimate goal of the corridor would be to connect to Cheyenne, Wyoming, to the north and New Mexico to the south. CDOT’s initial ridership model estimates that the Front Range rail service would attract between 1.5 million and 2.9 million riders annually.93
For CDOT and the state, building a high-quality passenger rail corridor along the Front Range would support two closely related goals. First, the line would “provide relief for our congested interstates.” Second, the Front Range line would “attract environmentally sustainable economic development and growth.” Additionally, the intercity passenger rail line would complement and strengthen Denver’s regional transit build-out known as FasTracks, which began with a local option sales tax increase approved by voters in 2004.94
The FasTracks build-out includes 113 miles of light rail and commuter rail as well as 18 miles of bus rapid transit.95 Local transit service collects and distributes intercity passengers from across the Denver metropolitan area, allowing travelers to complete an entire journey without needing to use an automobile. The alternatives study states, “All alternatives would result in a significant reduction in VMT through the Front Range region.”96 In fact, the study estimates that the passenger rail service would reduce VMT along the corridor by 63 million miles annually.97
The alternatives analysis prepared by CDOT looked at several different alignments. Each alternative involves a mix of new right of way as well as existing transit and freight rail lines. Depending on the final alignment, the project would cost between $8 billion and $13 billion to implement.98 And while this price tag is significant, it’s important to remember that population growth will require the state to spend billions of dollars to expand its existing transportation network. Thus, the choice isn’t between billions of dollars for rail or nothing but rather billions for rail or billions for highway expansion. For instance, in 2019, CDOT adopted a plan to spend at least $640 million on projects on I-25 over three years.99
While passenger rail and highway expansion may have similar cost profiles, these modal alternatives lead to very different social and environmental outcomes. To provide just one example, expanding I-25 would increase driving and regional air pollution, whereas building the Front Range passenger rail line would reduce driving and mobile source emissions. The Front Range passenger rail line has the potential to guide regional growth along a sustainable trajectory, helping to achieve national climate, equity, and inclusive economic development goals. Expansion of I-25 does not.
Conclusion
Taken together, these four projects demonstrate that infrastructure funding can be used to generate sustainable and inclusive economic growth without significant community dislocation and environmental harm. The RAISE grant program, which came out of the 2009 recovery act, provides a road map for how to leverage a major infrastructure stimulus bill to reduce GHG emissions, provide affordable access to opportunity, and redress some of the harms of past discriminatory projects. Importantly, achieving these goals cannot occur under the existing federal transportation policy and program structure. Congress has a once-in-a-generation opportunity to pass a major transportation and infrastructure bill such as the American Jobs Plan, but new federal spending must be paired with significant policy reforms.
About the author
Kevin DeGood is the director of Infrastructure Policy at the Center for American Progress.