This report contains a correction.
Introduction and summary
Wealth—a family’s financial net worth—measures how well people are prepared for the future. It allows them to purchase a home, start a business, enjoy a secure retirement, and put their children through school. Wealth also provides security in the face of emergencies, for example, allowing people to pay for unexpected health bills or pay bills following a layoff. Wealth is essential to giving families peace of mind.
Unfortunately, the accumulation of wealth in America is highly unequal. Wealth is increasingly unevenly distributed by race and ethnicity.1 White families in America have a median wealth of $142,180, compared with $20,765 for Latinx* families. (see Table 1) This large wealth gap leaves Latinx families economically insecure with fewer opportunities for upward economic mobility.
As this report documents, the gap between Latinx families and white families has persisted for decades and shows no sign of shrinking. Moreover, this wealth gap exists regardless of marital status, education, and income, suggesting that Latinx families encounter systematic obstacles to building wealth.
While Latinx communities face several obstacles to building wealth, their relationship with the labor market—the type of work they do and the kinds of jobs they hold—is a key contributor to their ability to build wealth. Despite having similar employment rates as whites and being more likely to have full-time work, Latinx individuals work in jobs whose overall quality is not ideal for building wealth. They are more likely to work in sectors with low-paying jobs that lack benefits essential to building wealth.
Simply put, Latinx families are caught in a precarious situation. Their inability to obtain higher-paying, more stable jobs means that they must rely on short-term savings to pay daily household bills. Yet at the same time, because of the low-quality of the jobs they hold, it is extremely difficult to save. Furthermore, Latinx families often have to stretch whatever little bit of savings they have paying bills instead of accumulating long-term savings.
While this report focuses on the wealth gap between Latinx families and white families, it is important to note that in 2016, the median wealth for black families stood at $17,600—lower than either of the aforementioned groups.2 In addition, while the disparity between white families and Asian American Pacific Islander (AAPI) families is often overlooked since, collectively, their average median wealth is similar, it is important to note that there is significant wealth inequality among different ethnic groups within the AAPI community, leaving many to struggle in retirement.3 Using data on household wealth for Latinx and white families, this report lays out policy recommendations to specifically address the distinct issues that exacerbate the Latinx-white wealth gap, but which can also be used to inform solutions to tackle wealth inequality overall.
In order to determine the extent of the wealth gap between Latinx and white families, the authors looked closely at 2016 Federal Reserve data, which is highlighted throughout this report. Their findings include the following:
- Latinx families had less than one-sixth the wealth of whites. In 2016, the median wealth of Latinx households amounted to $20,765, compared with $142,180 for white households.4 Therefore, the typical Latinx family had only 14.6 percent of the typical white family’s wealth. (see Table 1)
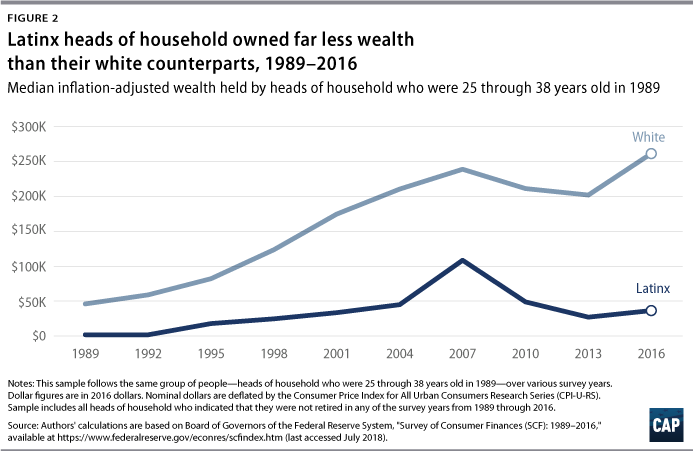
- The Latinx-white wealth gap has persisted over time and widened after the Great Recession. In 2007, just before the Great Recession, Latinx families had a median wealth of $32,656, which equaled 17.3 percent—more than one-sixth—of white families’ median wealth, $188,756. (see Table 1 and Figure 2) After the recession, this share widened to less than one-sixth. (see Table 1)
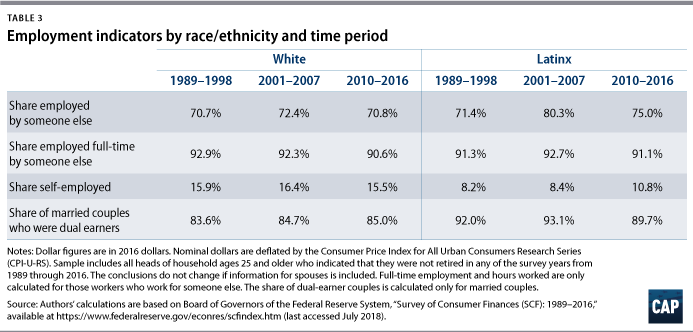
- Latinx people have a somewhat stronger labor force attachment than whites. Latinx people are employed at similar rates as whites and are more likely to hold full-time jobs. Latinx workers are also more likely to work for somebody else than whites—75 percent of Latinx workers versus 70.8 percent of white workers. Furthermore, Latinx couples are more likely to have two earners than white couples; 89.7 percent of Latinx couples include two earners, compared with 85 percent of white couples. (see Table 3)
- Latinx workers hold substantially worse jobs than white workers. Relative to white workers, Latinx workers earn much lower hourly wages, are less likely to have health insurance and retirement benefits through their jobs, and work in jobs that are much less stable. As a result, Latinx individuals suffer from higher unemployment rates and shorter time with employers and therefore have less time to gain access to key benefits. They also face a greater chance of experiencing negative income shock, for instance, due to an unexpected cut in hours.
- Latinx families face greater financial demands. Latinx individuals tend to have larger families and are more likely to support family members not living with them. Therefore, they are less likely than whites to be able to afford necessities and save for retirement or emergencies.
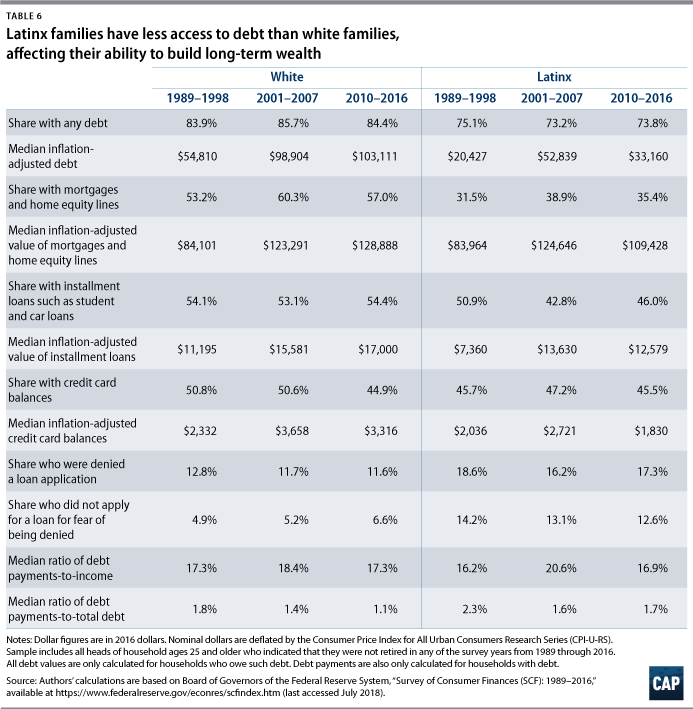
- Latinx families have costlier debt than whites. Latinx families are somewhat less likely to owe money, but they encounter greater financial market obstacles, such as discrimination and product steering, when getting a loan. As a result, Latinx families face greater debt burdens relative to their income and outstanding debt than white families. Latinx families owe a median debt of $33,160, about one-third the median debt of white families, $103,111; however, Latinx families’ median debt payments relative to income are very similar to those of white families—16.9 percent compared with 17.3 percent. (see Table 6)
- The wealth gap reflects large differences in homeownership, retirement account ownership, and business ownership. Between 2010 and 2016, less than one-third—29.3 percent—of Latinx families had any retirement account, compared with 64.1 percent of white families. Furthermore, only 47 percent of Latinx families owned a home, compared with 73.7 percent of white families. And only 6.6 percent of Latinx families owned a business, compared with 18.9 percent of white families. (see Table 7)
- Latinx families own assets with much lower values, even when they own such key assets. Between 2010 and 2016, the median retirement account balance for Latinx households was $20,622, compared with $64,960 for white households. (see Table 7)
Considering the persistent wealth gap between white and Latinx families, and given that wealth is the best measure of a family’s economic well-being, policymakers at the federal and state level should enact measures to improve the financial outlook for Latinx families.
*Authors’ note: A “Latinx” person is any individual with origins in Latin American. This term is preferable to “Latino,” which is not gender-inclusive, as well as “Hispanic,” which refers to people from Spanish-speaking countries—including Spain—whereas many Latin American countries are not predominantly Spanish-speaking. That said, “Latino” and “Hispanic” are used throughout the report when the underlying source uses such terminology. In addition, many of the figures in this document are based off Center for American Progress analysis of the Federal Reserve’s triennial Survey of Consumer Finances.
The large and persistent wealth gap
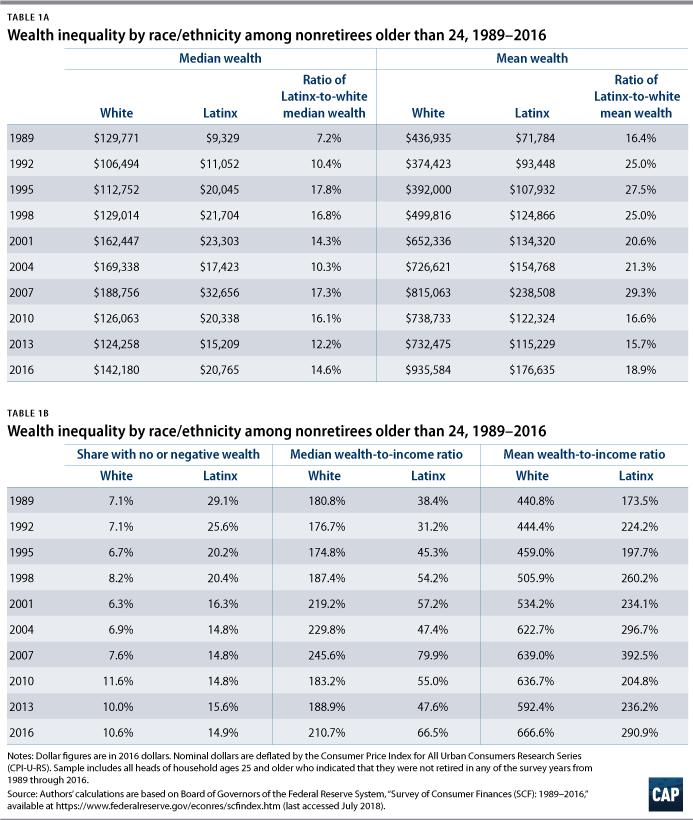
Latinx families typically have a lot less wealth than white families. In 2016, the median net worth of Latinx households amounted to just $20,765, compared with $142,180 for white households. In other words, the typical Latinx family had less than 15 percent of the wealth of the typical white family. (see Table 1A) This wealth gap leaves many Latinx families with little or no wealth to invest in their own future or respond to emergencies. For instance, in 2016, 14.9 percent of Latinx families had zero or negative net worth, compared with just 10.6 percent of white families. (see Table 1B)
This difference in net worth is not simply a reflection of Latinx households having less income. Economists often use wealth-to-income ratio to determine how well-prepared households are for the future; after all, wealth typically replaces wages both during emergencies and when people retire. However, the median wealth-to-income ratio for Latinx families is much lower than it is for white families. In 2016, Latinx households had a median wealth-to-income ratio of just 66.5 percent, compared with 210.7 percent for white households. (see Table 1B)
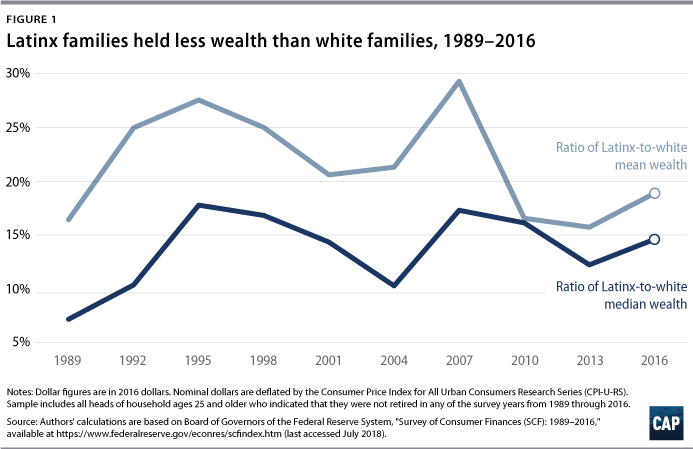
Data also reveal that Latinx families have faced systematic barriers to wealth building over time. As time has progressed, there has been no meaningful reduction of the racial wealth gap. (see Figure 1) In fact, the Latinx-white wealth ratio has moved up and down consistently over the past three decades. When the ratio was at its highest point in 1995, Latinx households had a median net worth that was just 17.8 percent of the median net worth of white households. (see Table 1A) And even when comparing average wealth for Latinx and white families, the ratio has never exceeded 30 percent, reaching a peak of 29.3 percent in 2007, just before the housing and stock markets crashed. (see Figure 1) The racial wealth gap only widened in the wake of the Great Recession.
Traditional protective factors are not enough
Protective factors are indicators that should improve upward economic mobility. (see Table 2) Yet data reveal that traditional protective factors, such as education, home ownership, income, and age, are insufficient for closing the racial wealth gap.
Education
Education has long been considered a vehicle for greater wealth and mobility; yet higher educational attainment alone is not enough to close the racial wealth gap. 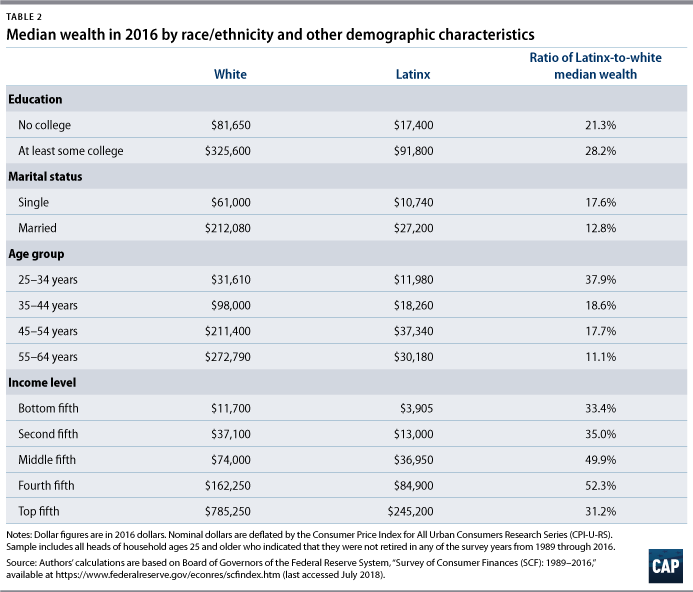 For example, only 17 percent of Latinx individuals received a four-year degree, compared with 39 percent of white individuals. Furthermore, according to analysis from Demos, for every dollar accrued to a college-educated median Latinx household, $13.33 is accrued to a college-educated median white household.5 The return on investment for college education surfaces not only in wages but in wealth building. For example, in 2016, Latinx people with a college degree had a median net worth of $91,800, compared with $325,600 for white people with a college degree. Disturbingly, the amount of wealth held by college-educated Latinx families is closer to that of non-college educated white families than it is to that of college-educated white families. (see Table 2) Ultimately, these data suggest that education alone is not enough to close the Latinx-white wealth gap and that Latinx people face systematic obstacles to building wealth, such as discrimination and student debt.
Homeownership
Homeownership is another tool that families use to grow their wealth. Unfortunately, Hispanic families often face systematic barriers to homeownership; are more likely to have high-risk, high-interest loans; and are frequently steered toward purchasing in segregated communities.6 As a result, in 2016, just 47.2 percent of Latinx families owned a home, compared with 73.7 percent of white families. (see Table 7) There are a number of factors driving the lower rates of homeownership among Latinx families. While Latinx families have less income and less stable jobs than their white counterparts, these disparities are only one piece of the problem. Latinx families are also more likely to have riskier loans and to face foreclosure and/or housing distress.7 Compounded together, these factors make it much more difficult for Latinx families to build wealth through home equity, even when they do own a home.
Income
Income is one protective factor that appears to shrink the racial wealth gap, if only slightly. Data show that the wealth gap closes as income increases—at least up to the fourth quintile of income distribution. (see Table 2) However, a substantial gap persists even at higher income levels.
In 2016, Latinx households with incomes in the fourth quintile had a median net worth of just more than half of that of white households in the fourth quintile—the narrowest wealth gap by income level. (see Table 2) This suggests that even as Hispanic families move up the income scale, their wealth still falls well behind that of white families.8 There are several likely factors at play here making it challenging for Latinx people to build wealth. These include greater income volatility and fewer benefits, even among higher-income households.9
Moreover, the share of Latinx families shrinks at higher income levels, meaning that the decreasing wealth gap by income level affects fewer and fewer Latinx families. For example, Latinx households make up nearly 25 percent of households in the bottom quintile but only slightly more than 12 percent of households in the fourth quintile.10 So, while the wealth gap declines as incomes increases, the vast majority of Latinx families face systemic barriers to high-income jobs.
Age
While household income typically increases as individuals age, the data indicate that the Latinx-white wealth gap widens as people get older. Latinx households with people between the ages of 25 and 34 have 37.9 percent of the wealth of white households. (see Table 2) Yet Latinx households with people between 55 and 64 years old have just 11.1 percent of the wealth of white households. (see Table 2) This phenomenon suggests that Latinx people may face greater economic struggles during their careers. It also indicates that the overall wealth gap is not driven by the fact that Latinx families are slightly younger, on average, than whites, but rather that systematic differences in job quality—such as lower income, fewer benefits, and less stability—persist as Latinx workers age.
Key factors contributing to the racial wealth gap
While traditional protective factors are insufficient to eliminate the racial wealth gap, several factors exist that exacerbate racial disparities in upward economic mobility.
Latinx workers are more likely to be employed in jobs with less stability and fewer benefits
Latinx individuals are employed at similar rates to their white counterparts.11 However, between 2010 and 2016, Latinx heads of household were more likely than white heads of household to work for someone else—75.0 percent versus 70.8 percent, respectively. In addition, only 10.8 percent of Latinx heads of household were self-employed, compared with 15.5 percent of whites.12 (Table 3)
In addition, labor market data reflect worse job opportunities for Latinx individuals. The jobs available to this group of workers tend to pay lower wages, have fewer benefits, and provide less stability than the jobs available to white workers. In fact, all indicators show that jobs for Latinx workers are much worse than jobs for whites. Between 2010 and 2016, inflation-adjusted median hourly earnings were $16.70 for Latinx and $24.80 for whites—a difference of almost 50 percent. (see Table 4)
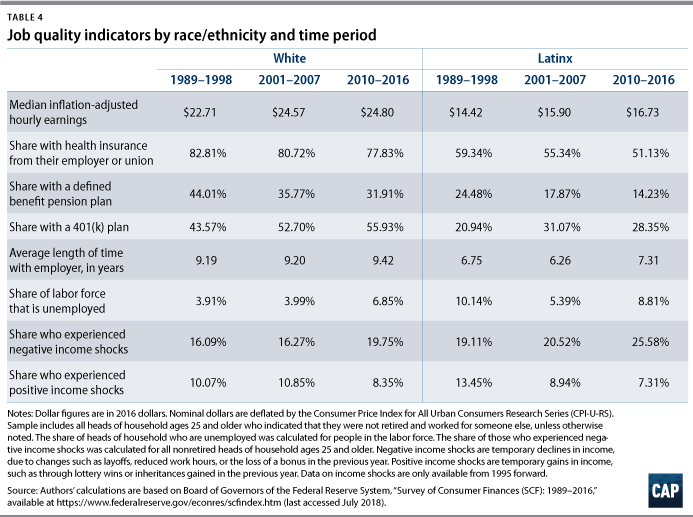 Even larger gaps exist with respect to retirement savings, as only 28.4 percent of Latinx workers had a 401(k) plan between 2010 and 2016, while 55.9 percent of white workers—almost twice as many—had a 401(k) plan. (see Table 4) Furthermore, compared with white workers, Latinx workers had less time, on average, with their current employer, indicating a lack of employment stability. Between 2010 and 2016, a typical Latinx worker had been with their current employer for 7.4 years, compared with 9.4 years for the typical white worker. Since eligibility for employment-related benefits, such as retirement plans, is typically based on tenure with the same employer, this employment instability creates an impediment to long-term saving for Latinx workers. This further explains why, between 2010 and 2016, lower percentages of Latinx workers held a 401(k) plan (see Table 4). Furthermore, just 51.1 percent of Latinx workers who were not self-employed had health insurance from their employer or a union, compared with 77.8 percent of white workers. (see Table 4)
This phenomenon can have a significant effect on wealth accumulation and economic mobility for Latinx households, especially when faced with unemployment or a negative income shock. Between 2010 and 2016, 8.8 percent of Latinx heads of household experienced unemployment, compared with just 6.8 percent of white heads of household. (see Table 4) During the same period, 25.6 percent of Latinx households reported a negative income shock—for instance, due to a layoff, cutback in hours, or loss of bonus—compared with just 19.1 percent of white households. (see Table 4) Job instability and insufficient benefits not only hinder upward mobility but also put Latinx households in a precarious economic situation.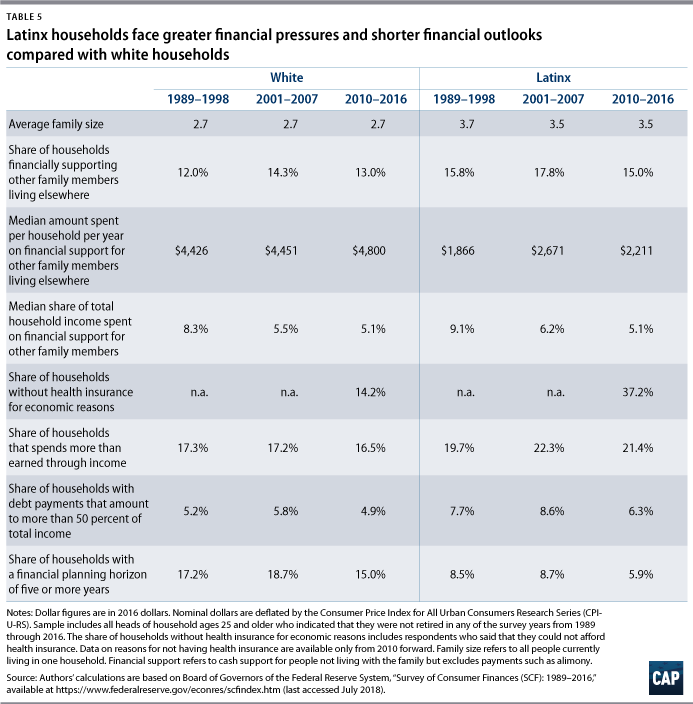
Latinx workers typically receive lower wages and struggle to make ends meet
Latinx people not only work in more precarious jobs, they also face greater demands on their finances. Between 2010 and 2016, the median Latinx worker made just $16.70 in inflation-adjusted hourly wages. During the same period, the median white worker made nearly 50 percent more—$24.80—per hour. (see Table 4)
Latinx families receive lower wages, worse benefits, and fewer resources than white families and therefore have a harder time making ends meet and saving for the future. Between 2010 and 2016, 21.5 percent of Latinx families’ spending outstripped their incomes, compared with 16.5 percent of white families. Furthermore, 37.2 percent of Latinx families indicated that they did not have health insurance for their family members due to economic reasons—mainly because they could not afford it—compared with only 14.2 percent of white families. (see Table 5) These increased demands on Latinx families force them to focus on short-term finances, which creates barriers to long-term wealth building.
Latinx households are burdened with costly debt
While Latinx families are less likely to have significant debt and their outstanding balances tend to be smaller, debt payments typically constitute a more significant portion of their income relative to their white counterparts (see Table 6) Between 2010 and 2016, 46 percent of Latinx families owed installment loans, compared with 54.4 percent of white families. (see Table 6) Latinx families with installment loans typically owed $12,579, whereas white families owed $17,000. (see Table 6) However, during this period, 6.3 percent of Latinx families had debt payments that constituted more than half of their income, compared with just 4.9 percent of white families. (see Table 5) And relative to the outstanding debt amount, Latinx families spent more than 50 percent more on debt payments than white families—1.7 percent versus 1.1 percent, respectively. (Table 6) As a result, debt often poses a greater obstacle to building wealth for Latinx families than for white families.
Latinx families lack access to homeownership, retirement savings, and entrepreneurship opportunities
While debt is a significant obstacle to building wealth, massive differences in assets are an even bigger contributor to the racial wealth gap. Between 2010 and 2016, Latinx households had inflation-adjusted assets amounting to just $27,666 at the median, compared with $235,515 for white households. (see Table 7) This disparity is larger than the overall wealth gap, indicating that the wealth gap is largely driven by differences in assets, not debt. (see Table 1)
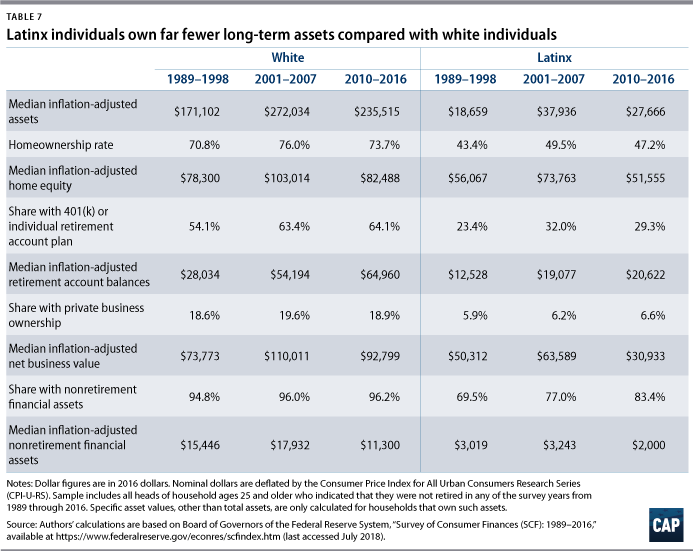
This massive gap in asset values reflects substantial differences in homeownership, retirement account holdings, and business ownership. Between 2010 and 2016, whites were more than twice as likely as Latinx individuals to have a retirement account and three times as likely to own a private business. (see Table 7) In 2011, 73 percent of white heads of household owned their own home, compared with just 47 percent of Latinx heads of household. In 2011, even among homeowners, the rate of return in home equity was 154 percent higher for whites than for Latinos.13
These differences in asset ownership reflect the labor market experiences of Latinx people. As stated above, they face tremendous barriers to stable, well-paying jobs that provide access to important savings vehicles. Finally, since Latinx families are less likely to be self-employed, they are also less likely to own private businesses, which can increase in value while providing a source of income.
Moreover, when Latinx families have any of such assets, the value of those assets is less than the value of similar assets owned by white families. For example, between 2010 and 2016, the median value of a retirement account for a Latinx household was just $20,622, compared with $64,960—more than three times as much—for whites. (see Table 7) During the same period, the median Latinx-owned business had an inflation-adjusted net value of $30,933, about a third of the $92,799 recorded for the median white-owned business. (see Table 7)
Significant differences in asset values result from several factors. Latinx people may have a harder time securing adequate financing for their homes and businesses, and they are more likely to end up paying higher interest rates—all of which can make it more difficult to build equity. Due to racial residential segregation, the homes of Latinx families may be in less stable neighborhoods, where home values appreciate more slowly and can fall more quickly in a recession than in white neighborhoods. They also have fewer resources to help finance their own businesses, as mortgages and other personal assets can typically be used to underwrite a small business. Put differently, Latinx families have lower homeownership and less home equity than white families and are less likely to own nonretirement financial assets, all of which impedes business ownership and growth of businesses.
The large wealth gap between Latinx families and white families reflects disparities in both the ownership of key assets and the value of those assets. These differences result from gaps in labor market outcomes and from structural differences—such as residential segregation and financial market discrimination—that limit access to affordable loans.
Recommendations
Systemic policy choices have created a large and persistent wealth gap that is largely unaffected by traditional protective factors. To reduce racial disparities in wealth building, lawmakers must deliver policy solutions that improve employment outcomes, support strong civil rights enforcement, expand access to critical savings vehicles, and reduce costly debt. These policies should be intentional and delivered using the equity framework of targeted universalism, which focuses on achieving universal goals through targeted interventions. The following recommendations, when implemented, should diminish systematic barriers to equality and improve upward economic mobility for Latinx households.
Improve employment and income
Policies addressing employment and wages must focus on equitable access to the labor market and equitable returns to participation.
Increase wages and benefits
It is harder for Latinx individuals to secure access to employment with high wages and a range of benefits, including health care and retirement. In 2016, 40 percent of white workers were employed in management, professional, and related occupations—routinely well-paying jobs with benefits—whereas only 22 percent of Hispanic or Latino workers were employed in such occupations.14 Comparatively, 25.4 percent of Hispanic or Latino workers and 16.5 percent of white workers were employed in the service sector. Meanwhile, 16.3 percent of Hispanic or Latino workers and 10.1 percent of white workers were employed in natural resources, construction, and maintenance fields.
As for the median weekly earnings in 2016, Hispanic workers earned $624, whereas white workers earned $862.15 Among working men, median weekly earnings were $663 for Hispanics and $942 for whites; among working women, the figures were $586 for Hispanics and $766 for whites. Furthermore, these earnings disparities hold even after controlling for occupation. For example, in management, professional, and related occupations, white men earned $1,427 at the median, while Hispanic men earned only $1,169. Access to higher wages with quality benefits is essential in helping to close the wealth gap for Latinx families.
Support union membership
Union membership increases wealth for all workers by providing them with better wages, access to better benefits, and increased levels of employment stability. Union membership allows for collective bargaining on wages, employment benefits, and other terms that can affect one’s employment. Access to higher wages and better benefits translates into increased savings and wealth building.16 However, only 10.5 percent of Hispanic or Latino workers are represented by a union; and, while still disappointingly low, 11.8 percent of white workers are union members.17 Between 2010 and 2016, families of color with union members in the household had a median wealth that was almost five times as large as the median wealth of nonunion households of color.18 Furthermore, a 2008 study revealed that unionization contributes a considerable wage premium of around $2.60 per hour, or a 17.6 percent increase.19
The Center for American Progress has long called for policies that increase worker power, including moving to industrywide collective bargaining; establishing work councils; developing worker organizations; and modernizing labor laws to ensure comprehensive protections and meaningful enforcement procedures.20
Raise the minimum wage
The federal minimum wage has been stuck at $7.25 per hour since 2009, which has led to a push to increase it to $15 per hour. With almost 60 percent Latino workers earning less than $15 per hour, increasing the minimum wage would have a disproportionately positive impact on earnings for this community.21 Higher wages would directly translate to increased savings and wealth.
Support a job guarantee
A job guarantee would provide an employer of last resort (ELR) model for workers who have been historically discriminated against or taken advantage of. Academics William Darity Jr. and Darrick Hamilton have long proposed implementing a federal job guarantee to increase the bargaining power of workers of color.22 A federal jobs guarantee—in which the government, acting as an ELR, hires all individuals who are willing and able to work—both raises wages and improves job stability, two key factors in building wealth through better labor market outcomes.
Improve access to health care
As noted, Latinx families are more likely than white families to experience income volatility, leaving them more likely to draw on savings or access financial assistance when health care emergencies occur. Prior to the enactment of the Affordable Care Act (ACA), more than 50 million Americans were uninsured, including 40 percent of Latinos.23 The ACA has lowered the uninsured rate overall and has increased health care coverage to an additional 4.2 million Latinxs.24 Further expanding access to health insurance and health care is essential to the long-term financial well-being of Latinx families. Better access to health benefits reduces immediate economic worries and costs for families and allows them to save for long-term expenses.
Support equal pay, paid leave, and child care policies
Comprehensive work-family policies are essential to closing the wealth gap between Latinx families and white families. More and more women—especially Latinas—are becoming heads of household or breadwinners in their families. In 2015, 40.5 percent of Latinas were primary or sole breadwinners; yet they were paid only 54 cents for every dollar that a white, non-Hispanic man earned.25 This pay disparity is significant and contributes to the inability of Latinx families to build wealth. Furthermore, the national average price for a child care center for an infant and a 4-year-old is $18,000, which is about 35 percent of the median income for Hispanic households.*26 A recent CAP report found that universal preschool in Washington, D.C., increased maternal labor force participation by 10 percentage points in eight years.27 Progressive policies such as equal pay, paid leave, child care, and universal preschool will help Latinx families build wealth. More time in the workforce allows for increased wages and the potential for increased job stability, thus leading to more opportunities to build wealth.
Protect Social Security
In 1935, the Social Security Act was signed into law, providing individuals 65 and older a continuing income after retirement. The goal, as then-President Franklin D. Roosevelt stated during the signing ceremony was to “frame a law which will give some measure of protection to the average citizen and to his family against the loss of a job and against poverty-ridden old age.”28 Due to eligibility requirements, many Latinx individuals are unable to access benefits. For example, people are required to contribute to payroll taxes under their own Social Security number for 40 quarters. In addition, Latinx individuals are more likely than whites to work less full-time hours—again, making it harder for them to meet this requirement. Therefore, only 75 percent of Hispanics access Social Security benefits, in comparison to 90 percent of white Americans. Despite these challenges, Social Security is critical for the Latinx community. Every year, 29 percent of older Hispanics are lifted out of poverty because of the program.29 Increased Social Security benefits would lift retirement incomes for Latinx people and would also reduce worry about the future, making it easier for individuals to focus on longer-term saving.
Support strong civil rights enforcement
It is essential that the United States continues to support civil rights enforcement of employment and housing discrimination. A recent NPR poll found that 1 in 3 Latinos reported facing discrimination when applying for jobs, being paid or promoted equally, and trying to rent or buy housing.30 The Equal Employment and Opportunity Commission is responsible for enforcing laws that prohibit employment discrimination. Furthermore, the Office of Federal Contract Compliance works to ensure that government contractors and subcontractors are in full compliance with civil rights and labor laws. And the Consumer Financial Protection Bureau is essential to protecting Latinx communities against predatory lending, fraud, and discrimination in the financial marketplace. By reducing discrimination in employment, housing, and the financial market, Latinx individuals and families will have more money to invest into wealth-building vehicles.
Build savings and reduce debt
Policies addressing savings and reducing debt must focus on eliminating racial disparities in access to housing, retirement benefits, banking, and higher education.
Expand home ownership
Housing is still one of the main vehicles for building wealth in America. This is especially true for Latinx families. In 2011, 73 percent of white households owned their home, compared with 47 percent of Latino households.31 In accessing mortgages, borrowers of color are, on average, charged higher interest rates than their white counterparts.32 According to research from the Center for Investigative Reporting released earlier this year, Latinos were denied home loans at significantly higher rates than whites in 25 cities, even when controlling for factors such as income.33 Furthermore, it is well known that disparities in neighborhood values provide differential return rates on homeownership. Moreover, Latino homeowners are systematically burdened with riskier loans, which increases the chance of foreclosure and housing distress.34 According to research conducted by Demos, if public policies were implemented to eliminate racial disparities in homeownership rates and return on investment in homeownership, the wealth gap between white and Latinx families would be reduced by 28 percent in terms of homeownership and 41 percent in terms of return on investment, respectively.35
Ensure access to affordable rental housing
The growing gap between stagnant wages and rental housing costs continues to grow, making it difficult for families to save for a down payment to purchase a home. Access to affordable housing is critical for the Latinx community. Between 2001 and 2010, Hispanic people comprised 39 percent of the 3.9 million increase in the number of renter households.36 Increasing the supply of affordable housing is essential in helping all families, but especially Latinx families, build wealth. CAP has proposed a “Homes for All” program that encourages the federal government to actively support the production of affordable rental homes and to challenge private-market development practices.37 To that end, CAP supports the elimination of exclusionary and restrictive zoning policies while promoting low-income housing tax credits; creating a federal renter’s tax credit for homeowners that is similar to the mortgage interest deduction; and increasing funding for housing vouchers. Lower and more stable rental costs leave more money in people’s pockets, which allows them to save more for the future.
Increase access to retirement vehicles
Latinx families need increased access to a number of wealth-building vehicles, especially retirement vehicles. Working-age Hispanic families are half as likely as white families to have a retirement savings account.38 This is largely due to Latinx people being employed in jobs that do not offer retirement plans. CAP has proposed establishing a National Savings Plan (NSP), which would operate similarly to the federal employee Thrift Savings Plan. The NSP provides an affordable retirement savings account for individuals who do not have access to such an account at their place of employment.39
Improve access to banking
More than 16 percent of Hispanic households lack access to a bank account, compared with just 3 percent of white households.40 According to a 2015 Federal Deposit Insurance Corporation (FDIC) survey, Hispanic and black households were much more likely than white households to report not feeling like banks were interested in serving them.41 In order to address the overreliance on payday lending and prepaid cards, financial institutions could work to improve their relations with these communities through outreach and could offer alternative affordable banking options. Policymakers should work to ensure that safe, affordable products are accessible and available to customers who feel disconnected to the financial mainstream.
Improve college access and affordability
In 2017, only 17 percent of Latinx individuals obtained a four-year degree, compared with 39 percent of white individuals. However, according to American Community Survey (ACS) data, the percentage of Latinxs earning a college degree rose by 9.4 percent points between 2007 and 2017. While this increase is significant, data further reveal that increased education levels do not help to close the wealth gap. For example, for every $1 in wages accrued to a college-educated median Latinx household, $13.33 is accrued to a college-educated median white household.42 This shows that Latinxs with higher levels of education still fail to secure better-paying jobs.
Furthermore, the cost for higher education continues to grow. Hispanic or Latino students default at a higher rate—36 percent—than their white counterparts, 22 percent.43 Making college more affordable would reduce Latinx students’ debt load when they enter the workforce, allowing them to start building wealth more quickly.
Remove language barriers to economic opportunity
Over the past 30 years, English proficiency among Latinx people has increased significantly. Yet still, today, almost 1 in 3 Latinos cannot speak English “very well.”44 Furthermore, while Latinxs make up just 18 percent of the U.S. population,45 they comprise 63 percent of the limited English-proficient population.46 Limited English proficiency can create significant barriers to economic opportunity—especially in the housing market, which is predominately aimed at English-speaking buyers. Lawmakers should work to remove language barriers to employment, as well as access to important savings vehicles such as financial products and the housing market. For example, UnidosUS has encouraged Fannie Mae and Freddie Mac to develop their first comprehensive language access plan in order to provide access to safe and affordable mortgage products.47
Support comprehensive immigration reform
There are an estimated 11 million undocumented immigrants living in the United States today48—a majority of whom are from Latin American countries.49 Many of these people have been in the country for more than a decade, and without a pathway to status, they lack the opportunity to contribute to their full potential.50 Nevertheless, they are working in key industries—such as agriculture, construction, and hospitality—and paying billions of dollars in taxes at the local, state, and federal levels.51 Yet their ability both to advance in their jobs and to attain higher education is adversely affected by their immigration status. A commonsense and humane policy would ensure that these immigrants can go through a background check, pay a reasonable fine, and be put on a pathway to citizenship—provided they meet certain conditions. By providing a path to legal status, such a law would break down major barriers that have restricted immigrants from getting better jobs and have made them vulnerable to workplace exploitation and wage theft.52
Outdated laws and policies that govern legal immigration to the United States need to be amended to better fit the country’s current—and ever-changing—labor needs. The nation’s immigration system should be responsive to reasonable market demands, reflecting America’s age-old promise as a land of opportunity while simultaneously maintaining its long and proud commitment to family reunification and humanitarian need.
Conclusion
The wealth gap between Latinx and white families, in part, is a result of how Latinx people interact with the U.S. labor market. The data reveal that a job alone will not help Latinx families build wealth—particularly if it is not a high-quality job that offers good pay and benefits. Intentional policy interventions must be taken to help Latinx families build wealth at a rate similar to their white counterparts. While there are several policy interventions that could close the gap, the key is to increase the number of Latinxs working in full-time jobs with quality benefits.
*Correction, December 6, 2018: This report has been updated to clarify that the national average price for a child care center is $18,000 for an infant and a 4-year-old.
About the authors
Danyelle Solomon is the senior director of Race and Ethnicity Policy at the Center for American Progress. Previously, she has served as policy counsel at the Brennan Center for Justice’s Washington, D.C., office; legislative counsel at the White House Office of National Drug Control Policy; and counsel to Sen. Benjamin L. Cardin (D-MD) during his tenure on the Senate Judiciary Committee.
Christian E. Weller is a senior fellow at the Center for American Progress and a professor of public policy at the McCormack Graduate School of Policy and Global Studies at the University of Massachusetts, Boston.
The authors would like to give a special thanks to Safia Sayed, a former CAP intern; and Connor Maxwell, a research assistant for Race and Ethnicity Policy at the Center.
Appendix
The data in this report come from the Federal Reserve’s triennial Survey of Consumer Finances (SCF), a nationally representative survey of U.S. household wealth. The SCF includes comprehensive information on household finances, including income and income volatility, as well as household wealth, including all assets, debt, and debt payments. It also contains information on savings attitudes and behaviors. The SCF further includes data on household characteristics, such as the race, age, and education of the head of household. It contains consistent information for most variables of interest since 1989, providing data from 10 survey years through 2016 for this analysis.
This report uses several measures of household wealth to capture wealth inequality. Wealth is the difference between all financial and nonfinancial assets, such as cars and all debt. The wealth measured in this report includes average wealth; median wealth; the median wealth-to-income ratio; the average wealth-to-income ratio; and the share of households with no or negative wealth.
The report also further details household assets and debts. It specifically shows the homeownership rate; the share of households with retirement savings accounts; the share of households with privately held businesses; and the share of households with any nonretirement financial assets, such as checking and savings accounts. It also reports the median inflation-adjusted values of those assets for households that have such assets. As for debts, the report includes information on mortgages and home equity lines; installment loans, such as student and car loans; and outstanding credit card balances. The report also shows the median outstanding balances for those households that have such debt.
The data allow for the calculation of a number of indicators that capture a household’s employment outcomes. These include whether the head of household works for somebody else or is self-employed. The SCF also collects information on whether those who work for somebody else work full time or part time. And it contains information on whether both spouses in a married couple work.
The SCF further contains key information on job quality. The relevant variables include current wages; health insurance from the employer or through a union; retirement benefit coverage; and time with the current employer. And the dataset contains information on labor market-related instability such as the chance of being unemployed and negative income shocks. Negative income shocks refer to temporary deviations in families’ usual income, for instance, due to layoffs, cutbacks in hours, or losses of bonus payments.
A number of indicators of spending, savings behavior, and financial attitudes round out the data discussion. These include an indicator of whether the family spends more than their income, as well as an indicator of whether the household forewent health insurance for somebody within the household due to economic reasons as measures of whether negative income volatility puts extra demands on household consumption. Economic reasons include lack of money, layoffs, and loss of public assistance. This measure serves as an indicator of severe spending cuts due to economic reasons. Moreover, the data include an indicator of whether the family saves regular or irregular amounts and an indicator of whether the household has a financial planning horizon of five years or longer. These measures capture whether families focus on short-term financial planning rather than long-term savings goals.
The analysis only includes nonretired heads of household from ages 25 through 65 years in order to capture potential labor force participation. The data summary also groups the data by years—specifically from 1989 to 1998; from 2001 to 2007; and from 2010 to 2016. The break points coincide with the past two recessions. Grouping the data by years allows for sufficient sample sizes and simplifies the discussion. Using data for individual years instead of grouped data does not change the conclusions.53