Introduction and summary
The benefits of electric vehicles (EVs) are wide-ranging and well-documented. Electric vehicles have fewer tailpipe emissions than internal combustion engine (ICE) vehicles, leading to public health benefits associated with better air quality;1 they are also quieter.2 Furthermore, they reduce U.S. dependence on foreign oil, which is beneficial for national security.3 Electric vehicles can have significantly lower fuel costs and total costs of ownership, compared with gasoline-powered vehicles.4 Importantly, they are one of the most promising ways of reducing carbon emissions from the transportation sector,5 which is the largest contributor to U.S. greenhouse gas emissions.6
Although the electric vehicle market is growing, it comprises a small percentage of cars on the road. Issues such as initial cost, range, model availability, knowledge gaps, and the availability of charging infrastructure continue to inhibit vehicle deployment. Government has a strong interest to support the developing electric vehicle market and promote innovation in this sector. Yet progressive leaders who want to incentivize sector growth may not be aware of the existing policy options and, more importantly, of those policies’ effectiveness in actual electric vehicle deployment.
This report assesses policies that could be effective at increasing the share of light-duty plug-in electric vehicles (PEVs)—small vehicles that can be plugged in to a power source. First, it surveys national-level policies in the United States, Norway, and China. Then, it conducts a quantitative analysis of what policies have worked at the state level in the United States.
The report focuses on policies targeted at vehicles rather than charging infrastructure. Although many states have additional policies specific to charging infrastructure, in the analysis, these were not considered in depth due to the added scope and complexity of the issues. There is great anticipation regarding the role of forthcoming funds available to states through the Volkswagen Mitigation Trust (see text box below), which can complement existing state polices and help to build out charging infrastructure. Since a retrospective review is not yet possible, and the funds are available primarily for charging infrastructure, they also are not considered here.
Volkswagen Mitigation Trust
Volkswagen agreed to settlements to resolve the federal government’s allegations that the company cheated emissions standards.7 Of the settlement funds, $2.7 billion will be used to establish an Environmental Mitigation Trust. Over the next 10 years, states and territories may use the funding available to them in this fund to invest in specific transportation projects that are proven to reduce nitrogen oxide (NOx) emissions. States may allocate up to 15 percent of their funds to build electric vehicle charging infrastructure.8 Outside of the Mitigation Trust, Volkswagen will also invest $2 billion in charging infrastructure and in the promotion of zero-emission vehicles—such as battery electric vehicles, plug-in hybrid electric vehicles, and fuel cell electric vehicles.
While this report focuses on the policies targeting vehicles, it also finds that financial incentives for charging infrastructure are some of the most effective ways to influence the share of PEVs in a given state. Other key findings include:
- Excluding California, the zero-emission vehicle mandate is the best predictor of states with high plug-in electric vehicle market shares.
- Financial incentives for vehicles, such as rebates and tax credits, are very effective.
- Free high-occupancy vehicle (HOV) lane access is useful—but less so outside of California.
- On average, state government fleet acquisition requirements are poor predictors of government fleet market share; however, in some cases they have proven effective.
- Eliminating emissions testing fees or licensing fees does little to increase sales.
- Policies that are aimed at raising revenue for infrastructure by increasing licensing fees do so without inhibiting market growth.
As states take on an increased leadership role promoting electric vehicles, they should consider what policies put more of these vehicles on their roads.
Overview of EV technology
“Electric vehicles” is a broad category that can mean different things in different situations. To avoid confusion, this report generally avoids using the term “electric vehicle.” When the term is used, it is intended to represent all vehicles that can run on some form of electric power. Figure 1 shows the different types of electric vehicles and some example models.
Vehicles
The first commercial electric vehicle hit U.S. streets in 1897, and, in the early 1900s, electric vehicles made up one-third of all vehicle sales.9 Concerns about battery range, coupled with the cheap availability of gasoline, led the ICE vehicle to dominate the market throughout the 20th century. However, electric vehicles could once again become the vehicles of choice in the United States.
This report focuses on the benefits of and policies related to the deployment of plug-in electric vehicles (PEVs), which made a resurgence in U.S. markets during the early 2000s.10 PEVs can be charged in whole or in part by an off-board electric power source. This is distinct from hybrid electric vehicles (HEVs), which supplement an internal combustion engine with battery power—often charged through regenerative braking—but cannot be plugged in. The most popular HEV in the United States is the Toyota Prius.11
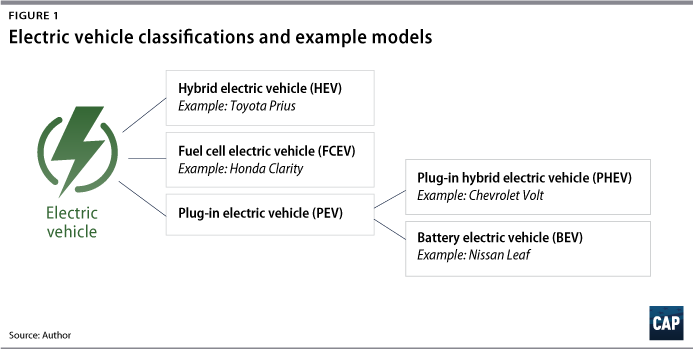
Plug-in electric vehicles are further divided into plug-in hybrid electric vehicles (PHEVs) and battery electric vehicles (BEVs). PHEVs typically run on electricity for shorter ranges—currently up to about 40 miles—then switch over to a gasoline-powered ICE when the battery is depleted. BEVs run only on electricity; they typically travel up to 100 miles on a single charge, and high-end models can reach up to 250 miles.12
Fuel cell electric vehicles (FCEVs)—another kind of electric vehicle distinct from PEVs—use an electric motor instead of an ICE to power the wheels; however, instead of plugging into the grid to recharge, FCEV storage tanks are filled with hydrogen gas, which generates electricity when combined with oxygen in the air. (see text box for more information)
Fuel cell electric vehicles
FCEVs operate by using hydrogen or another fuel to create electricity and power an electric motor. With high energy efficiency, lower life-cycle carbon emissions than internal combustion engines, and water as the sole exhaust byproduct, FCEVs offer a clean alternative to conventional light-duty vehicles and battery electric vehicles.13 To date, there are just three commercial FCEV models available in the United States, and several states have FCEV-supportive policies on the books, such as rebates, tax exemptions, credits, and rules regarding hydrogen infrastructure.14 From 2013 to 2017, only 3,035 FCEVs were registered in the United States, compared with 651,972 PEVs.15 In addition to being a more nascent technology than BEVs, FCEVs face similar but earlier-stage deployment challenges for related hydrogen fueling infrastructure. Major hydrogen production sites exist across the United States, but hydrogen fueling stations remain limited to 38 locations in California.16
Charging infrastructure
PEVs can be connected to the electricity grid and recharged through charging infrastructure—sometimes referred to as electric vehicle supply equipment (EVSE). The types or levels of charging infrastructure are commonly defined as Level 1, Level 2, and direct current (DC) fast chargers. As battery technology improves, vehicles will be able to go farther on a single charge.
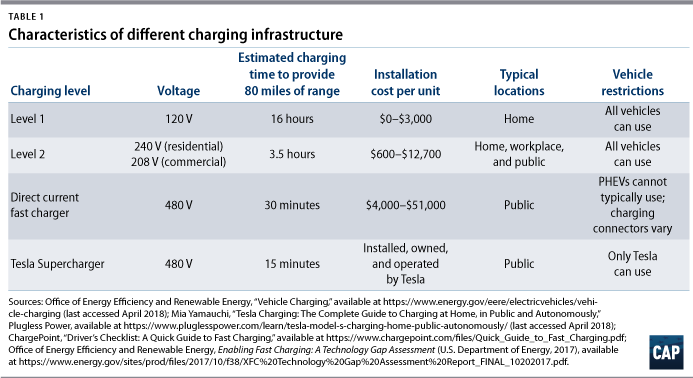
All commercially available PEVs can generally use the same Level 1 and Level 2 charging equipment.17 Tesla has a proprietary plug and DC fast charger called the Supercharger, which can only be used by Tesla’s vehicles.18 Extreme fast chargers, operated at 800 volts, have also been proposed, though they are not yet commercially available.19 Adding these chargers could add a host of challenges to those already complicating the PEV market. For example, extreme fast chargers would need to be compatible with existing BEVs, and the high rate of energy transfer between charger and grid would require heavy cables and additional cybersecurity measures.20
State of the PEV Market
Large-scale PEV deployment is necessary to achieve significant carbon emissions reductions in the United States. Yet, despite a variety of national and subnational goals and commitments related to electric vehicle deployment, market growth has been slow.
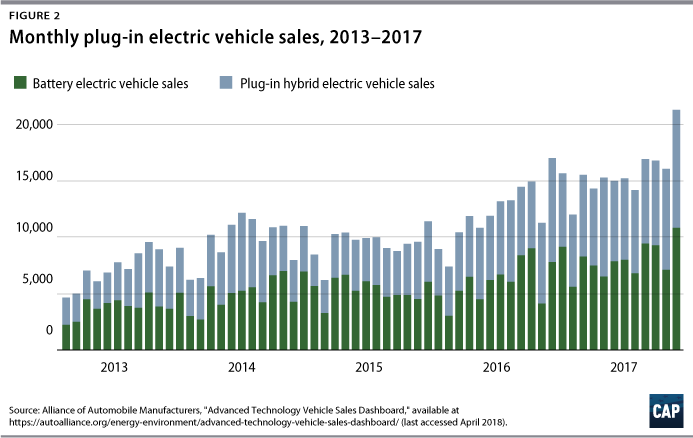
From 2013 to 2017, the United States added 651,972 PEVs, reaching an overall market share of 1.19 percent in 2017.21 While there has generally been an increase in PEV sales over time, market growth has risen inconsistently on a month-to-month and quarter-to-quarter basis. (see Figure 2)
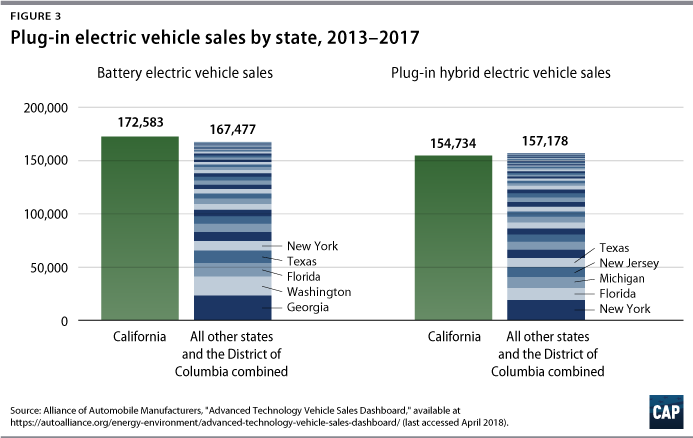
The electric vehicle market in the United States is largely driven by what happens in California. Despite representing just 12 percent of the country’s population, California typically represents more than half of PEV sales, 20 percent of HEV sales, and nearly 100 percent of FCEV sales in the United States.22 If California were a country, it would have ranked 3rd globally for PEV market share in 2016.23
Outside of California, PEV sales vary widely by state. (see Figure 3) New York, Georgia, Washington, Florida, and Texas follow California in terms of the number of PEVs sold between 2013 and 2017. Most of the top PEV-selling states added more BEVs than PHEVs during this time period, but New York had more PHEVs than BEVs.
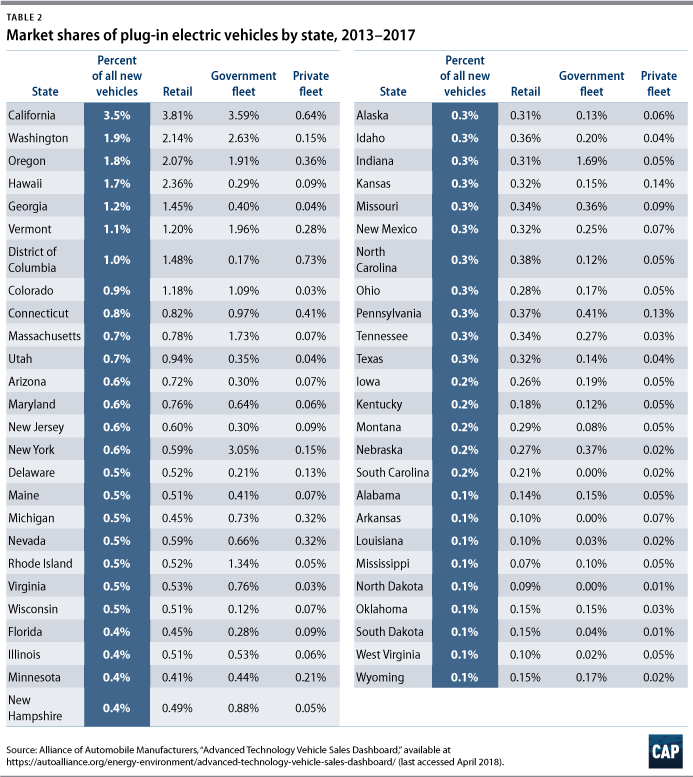
In terms of overall market share, California, Washington, Oregon, Hawaii, Georgia, and Vermont stand out. (see Table 2) California, Washington, and Georgia rank highly for both total sales and overall market share. Considering government fleet vehicles alone, New York, Indiana, Massachusetts, and Rhode Island boast far higher market shares than their respective market shares for all vehicles combined. In most states, retail market share tends to be higher than the market share for government or private fleets—such as rental cars, taxis, and corporate cars. California leads in terms of overall, retail, and government market shares but not private fleets. The District of Columbia just exceeds California in terms of private fleet market share. Across all states, the private fleet market share of PEVs was less than 0.75 percent and less than the overall PEV market share in that state.
Barriers to PEV adoption
Although the PEV market is growing, PEVs still comprise a small percentage of cars on the road. Barriers to PEV adoption have prevented these vehicles from gaining large market share. These barriers include:24
- Cost and range
- Model availability
- Knowledge gaps
- Charging infrastructure
In a survey of drivers in California and nine Northeast states, consumers cited—in rank order—lower purchase price and being able to drive 200 miles on a fully charged battery as the top two attributes that would make them more likely to consider purchasing or leasing a PEV. For Northeast drivers, the third choice was greater selection of plug-in vehicle models; for California drivers, it was seeing more plug-in vehicle charging stations in parking lots and shopping destinations.25 As stated above, this report primarily focuses on barriers related to vehicles, but it also touches on charging infrastructure.
Cost and range
The average price of BEVs has risen slightly over the past several years.26 As a relatively new technology, PEVs tend to be marketed as luxury vehicles first. The number of models available has risen, but most of these have been luxury models, and thus average list price continues to increase. Despite this, the list prices of PEV models and total costs of ownership—excluding financial incentives such as rebates or tax credits—are becoming more competitive with ICE vehicles.27
While total costs are still high, as battery technology improves, both the cost per mile of electric range and the overall electric range are falling.28 Between 2010 and 2016, the price of lithium-ion batteries fell nearly 75 percent, and Bloomberg New Energy Finance predicts that 2030 prices will be 93 percent below 2010 prices.29 Few models have high all-electric ranges; of the 14 model year 2018 BEV models,30 just four listed a range of more than 200 miles.31 Federal investment in battery technology has helped to increase the range and bring down the cost of batteries, so it is likely that the cost and range of vehicles will fall in the coming years.32
Model availability
Consumers are used to a wide variety of vehicle models from which to choose. There are currently 18 PEV compact car models on the market, five standard four-wheel drive SUVs, one minivan model, and no trucks.33 In 2016, pickup trucks—specifically the Ford F-150, Chevrolet Silverado 1500, and GMC Sierra 1500—were the top-selling cars in 29 states.34 A recent survey of light truck owners found that 15 percent would consider purchasing an all-electric light truck of the same make and model as their current vehicle.35 Due to the lack of options in preferred model classes, it may be harder for automakers to encourage consumers to purchase PEVs, and some have argued that a variety of PEV model options is a prerequisite for market growth.36
Major automobile manufacturers have committed to deploying many more PEV models in the coming years. For example, Volvo has committed to producing five BEVs by 2021.37 General Motors plans to announce 20 new PEV or HEV models by 2023.38 And Ford is planning to release 16 new BEV models and 24 new PHEV or HEV models by 2022.39 BMW,40 Honda,41 Hyundai,42 Mazda,43 Mercedes-Benz,44 Toyota,45 Volkswagen/Audi,46 and Nissan47 have all committed in some form to investing in electric vehicles in the next decade.
Knowledge gaps
Surveys have repeatedly found that consumers have very little knowledge of PEVs and that increasing consumer awareness and familiarity is vital to supporting a robust PEV market.48 The vast majority of consumers are unaware of how PEVs work, how much they cost, which models are available in their area, and what incentives—such as rebates and tax credits—may be available to them.49 In one survey, 95 percent of respondents were not aware of state or local incentives available.50 Despite making progress on issues of model and charging infrastructure availability, there has not been a corresponding increase in consumer awareness, even in pro-PEV California.51
“Electric vehicles” do not have a standard definition. The term “electric vehicle” can encompass PEVs and HEVs, just PEVs, or just BEVs. It can even be misunderstood as simply HEVs. There are many different levels of electrification and charging infrastructure, all with similar names, which contributes to confusion; and industry and policymakers alike have done little to standardize the language.
Even as a researcher devoted to finding this information, it was challenging for the author to determine the policies in each state and the opportunities available to consumers. There is no one-stop shop for consumers to easily determine the PEV incentives that apply to them. Depending on consumers’ income level, geographic location, and electric utility, they could be eligible for a host of incentives for vehicles and/or charging infrastructure. The variation in state laws and lack of clear information have left some consumers frustrated. For example, South Carolina offered PHEV tax credits until they were phased out in 2016, but several consumers mistakenly applied for credits for their BEVs.52 A recent study found that among dealerships in the top-10 PEV markets—excluding Tesla—unprepared staff, inconsistent practices, and limited inventory and information led dealers to push consumers toward non-PEV models they were more comfortable selling.53
Charging infrastructure
Charging infrastructure is a necessary companion to PEVs, and barriers to charging infrastructure deployment also inhibit vehicle deployment. Currently, charging infrastructure is mostly in metropolitan areas in the Northeast and on the West Coast.54 Unsurprisingly, this is similar to the vehicle market.
While the following section briefly describes some of those barriers, this report focuses its analysis on vehicle-specific policies as well as some policies aimed at funding the deployment of charging infrastructure. The Rocky Mountain Institute, Union of Concerned Scientists, and Citizens Utility Board provide more detailed information about charging infrastructure barriers and potential policy solutions.55
Barriers to charging infrastructure deployment include:
- Cost of infrastructure: The cost of deploying charging infrastructure can be extremely expensive. (see Table 1) Because of the high capital costs, it can be difficult to incentivize charging infrastructure to be built in underserved or disadvantaged communities.
- Cost of charging: Since current utility rate structures generally are not designed to account for PEV charging, prices vary widely by state, locality, and even charger.
- Accessibility of charging: Charging infrastructure is generally relatively easy to obtain for interested single-family homeowners in homes with parking; however, renters and multiunit dwelling residents face more challenges. Renters are unlikely to invest in permanent infrastructure that remains if they leave; most multiunit dwelling owners do not yet see PEV charging as a profitable amenity; and lack of a dedicated parking space can make it challenging for homeowners or renters to plug in when needed.56
- Utility investment: Utilities will need to be involved in charging infrastructure policy and, potentially, in deployment; yet current utility regulations could make it hard to generate utility investment. To justify the rate case for investments in charging infrastructure, for example, utilities may need to present complex cost-benefit analyses to regulators, which are complicated by uncertainty about market growth.57 Regulators must trust future benefits of investment that may not be obvious at the time– something they may be unlikely to do.
- Interoperability: Vehicles and charging infrastructure are not all compatible with each other (see Table 1), and not all charging infrastructure networks use the same payment systems. Different charging providers accept credit cards, smart phones, cash, or other methods of payment. Some companies require a membership to access their infrastructure before one even pays for the electricity.58
Solving charging infrastructure issues will require a set of dedicated policy solutions and must involve public utility commissions and municipal governments in addition to state governments.
U.S. federal and international government policies
Since the early 1990s, the U.S. federal government has been proactive in helping bring PEVs to market and incentivizing their use. Congress has legislated tax breaks, fleet acquisition incentives, manufacturing incentives, and authorizations for research and development.59 The executive branch has partnered with the public and private sectors on procurement of vehicles at all levels.60
Most significantly, in 2008, Congress made available PEV tax credits of $2,500 to $7,500 per vehicle, which have since been extended.61 The tax credits have been attributed to boosting PEV sales across the country. One study attributed more than 30 percent of U.S. PEV sales to the federal tax credit, with an impact of up to 49 percent for the Nissan Leaf.62
The policy, while successful, has also been criticized for having a manufacturer-based cap and a lack of indexation.63 Each major manufacturer can have 200,000 vehicles subsidized under the tax credit, and, after that, the incentives phase out. As of the publication of this report, Tesla and General Motors are predicted to hit the 200,000-vehicle threshold in 2018.64 Critics argue that this cap hamstrings the market and that the credits would be more effective if they had an expiration date instead.65 Furthermore, by not indexing the value of the credit to inflation, the credits are worth less in real dollars than they were when they were first introduced in 2008.66
Other federal programs have helped to reduce the cost of batteries, make consumers more familiar with PEV technology, and deploy charging infrastructure. For example, the Department of Energy’s (DOE’s) Workplace Charging Challenge partnered with hundreds of employers who committed to providing employees with access to charging by 2018.67 The program familiarized people with PEVs and helped increase the number of charging stations; nearly 7,500 stations were planned or installed.
Examples from Norway and China
Looking to other countries can also provide examples of policies that are effective at bolstering PEV sales. The following section surveys policies in Norway—the country with the largest PEV market share—and China, the country with the most total sales of PEVs and comparable market share to the United States.
Norway
Norway is by far the world’s leader in electric vehicle market development. In 2016, Norway’s market share of PEVs and FCEVs combined was 28.76 percent, vastly exceeding the next largest national markets: the Netherlands at 6.39 percent, Sweden at 3.41 percent, and France at 1.46 percent.68 Since 1990, the Norwegian parliament has taken aggressive steps to reduce its greenhouse gas emissions by enacting a suite of pro-EV policies. It has: 69
- Removed purchase and import taxes
- Reduced taxes for vehicle registration, company cars, purchasing and leasing, and license fees
- Provided free toll road and bus lane access, municipal parking, and vehicle charging
- Reduced ferry rates
- Financed fast charger stations every 50 kilometers—31 miles—on all main roads in Norway by 2017; the installation of these charger stations was completed by 2018.70
The policies are generally aimed at making PEVs less expensive than ICE vehicles, and they have been successful in large part because of the high cost of car ownership in Norway. In addition to the purchase price and sales tax, an ICE vehicle owner in Norway must also pay annual value-added taxes based on the vehicle’s emissions—up to 29 percent of total vehicle cost—road and ferry tolls, registration taxes, and $881 per month on gasoline on average, the highest rate in Europe.71 Now that incentives have largely made PEVs self-sustaining, parliament plans to phase out or replace the incentives. Norway’s political parties have also agreed to develop a new taxation system that will impose high taxes on high-emission cars and low or no taxes on low- or zero-emission cars.72
Norway continues to set ambitious goals for PEV deployment. By 2030, the current National Transport Plan calls for 100 percent of light-duty vehicles, 75 percent of long-distance buses, 50 percent of new trucks, and 100 percent of new heavy commercial vehicles to be zero-emission vehicles.73 With good consumer knowledge of PEV technology, incentives and subsidies in place, and a robust network of charging infrastructure, the country is likely to achieve its targets and further demonstrate the great potential for PEV deployment worldwide.
China
China leads the world in total PEV sales. Chinese sales have risen continuously since 2010 and the country’s 2016 market share for PEVs and FCEVs—1.37 percent—ranked China sixth in the world.74 This is no accident. At the national, provincial, and local levels, the Chinese government has implemented policies and incentives to increase PEV deployment in an attempt to solve its pollution crisis, reduce greenhouse gas emissions, and bolster its domestic automotive industry.75
In 2015 alone, the Chinese central government provided more than $8.4 billion in PEV incentives to consumers—about $4,800 per PHEV and $7,000 per BEV.76 Comparatively, the United States will spend just $2 billion on PEV tax credits from 2010 through 2019.77 Chinese provinces and municipalities often provide large subsidies to consumers too, nearly matching those at the national level.78 Due to local restrictions on license plate access that aim to reduce driving, one of the most effective incentives has been free PEV license plates in some cities.79 Government fleets have also been the subject of policy focus. Launched in 2009, the “Ten Cities, Thousand Vehicles” program funnels national funding to localities for public sector PEV use. The program reportedly has had mixed success, but it has grown rapidly and influenced local policy and incentives.80
State policies
States have broad latitude to influence PEV adoption through policy, and many states have developed a suite of innovative measures with varying success. The author of this report categorizes these policies and conducts a statistical analysis in order to determine, on average, which policies can effectively increase PEV market share in a state.
The policies considered in this study are:
- Rebates, tax credits, and grants for charging infrastructure
- Rebates and tax credits for vehicles
- Zero-emission vehicle mandates
- Free HOV lane access
- Fleet acquisition requirements
- Licensing fees
- Emissions testing fee exemptions
California is a clear leader, and including the state in the analysis could maximize or minimize the effects of successful policies in other states. Tests were run with and without California included in order to provide a better sense of what policies are useful in the states trying to catch up.
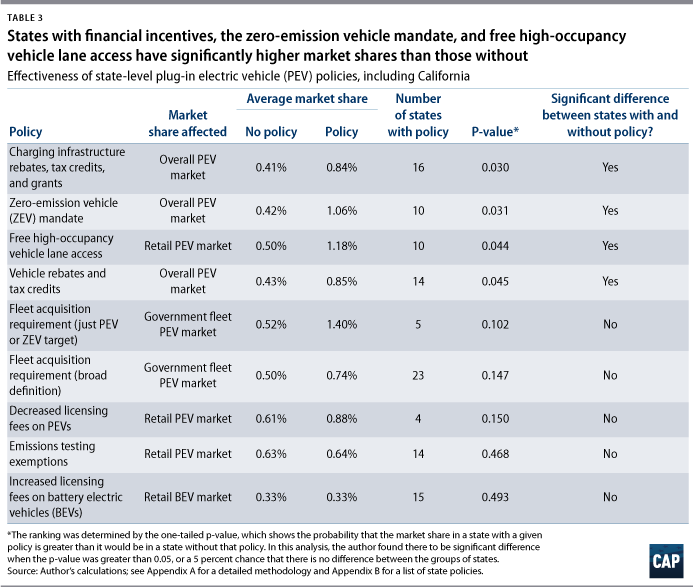
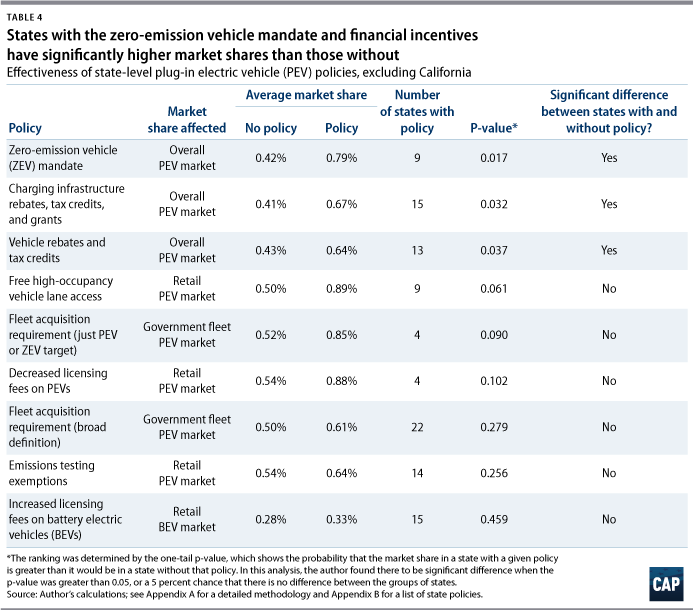
The following sections review in detail each state policy type listed above, explaining the key findings and policy design details and variations. Table 3, which includes California, and Table 4, which excludes it, present a summary of the policies tested, ranked by their ability to influence relevant market share. See Appendix A for a detailed study methodology and Appendix B for a list of state policies by type.
Financial incentives for charging infrastructure
Financial incentives for charging infrastructure in the form of rebates, tax credits, and grants are effective at increasing PEV market share. Although this report focuses on policies targeted at vehicles, given the importance of charging infrastructure to PEV deployment, the author also tested the impact of financial incentives for charging infrastructure in the form of government-funded grants, tax credits, or rebates. (see Appendix B) When California is included, charging infrastructure incentives provide the strongest link to the observed share of PEVs in a given state. These incentives are still important when California is excluded, though not to the same degree.
Notably, in states with incentives, there are significantly higher levels of Level 2 and DC fast chargers per capita. (see Appendix B) A basic regression analysis linking charging infrastructure per capita to PEV market share shows that per capita charging can only explain about half of observed market share, regardless of whether California is included. These results indicate that financial incentives are effective at increasing PEV market share and the amount of charging infrastructure per capita, though increasing charging infrastructure is far from the only driver of vehicle sales. It is somewhat surprising that financial incentives for charging infrastructure were generally better predictors of market share than policies focused on vehicles specifically.
Financial incentives for vehicles
Financial incentives for PEVs in the form of rebates and tax credits are effective at increasing PEV market share. This report limits its analysis to states that have or had a government-provided rebate or tax credit for PEV sale that could be used by all consumers, regardless of geographic location. The value of the incentive varied from $500 to $6,000. Most incentives were around $2,000, depending on the vehicle type. (see Appendix B)
Financial incentives for PEVs in the form of rebates and tax credits are effective at increasing PEV market share, regardless of whether California is included in the analysis. This finding is consistent with many published studies.81 Other studies have also shown that financial purchase incentives alone may not be sufficient to promote sales.82 This analysis shows that financial incentives alone are linked to significantly higher market shares of PEVs, though each of the states with tax credits or rebates has enacted a variety of other laws that could help bolster its PEV market as well.
Although simply having a rebate or tax credit appears to explain PEV market share differences among states, the design of vehicle-based financial incentives is still important. Experts suggest that the most effective incentives would be applied at the point of sale and would promote the purchase of PEVs with high electric ranges over those with low ranges.83 Colorado, New York, and Vermont provide a tax credit that can be administered at the point of sale, which allows dealers to effectively lower the sticker price of vehicles. And several states have set variable incentives based on the battery capacity of a vehicle in order to more accurately reflect its environmental benefits. (see Appendix B) PHEVs that can run on gasoline have higher emissions—as do BEVs with shorter ranges that need to be recharged frequently.
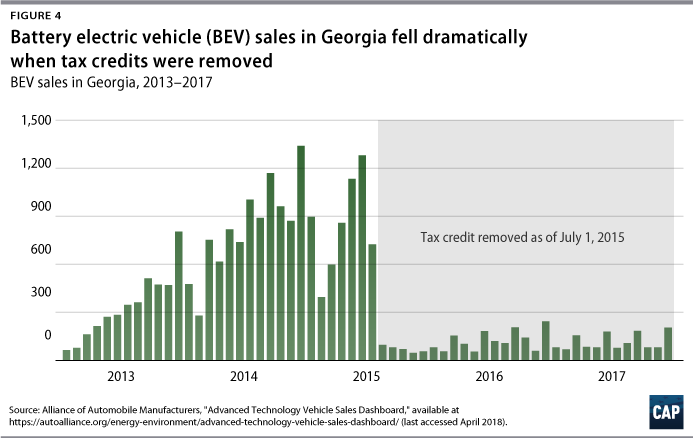
It is also important to avoid prematurely removing financial incentives. The case of Georgia’s halted tax credit is a reminder that the PEV market is still nascent and sensitive to both positive and negative changes. In 1997, the Georgia Legislature approved a $5,000 tax credit for BEVs, which, among other factors, led to a rise in BEV sales.84 When the state Legislature removed the tax credit in July 2015, sales promptly plummeted and have not returned to their former levels.85 (see Figure 4)
Zero-emission vehicle mandate
The zero-emission vehicle mandate is effective at increasing PEV market share, and, when excluding California, it is the most effective single policy. Under the Clean Air Act, California has authority to set stricter emissions standards for all vehicles and to establish a zero-emission vehicle (ZEV) mandate, and other states can adopt the California standard. 86 The term “zero-emission vehicle” includes BEVs, PHEVs, and FCEVs. Thirteen states and the District of Columbia have adopted California’s stricter emissions standards. Nine of these states also participate in the ZEV mandate: Connecticut, Maine, Maryland, Massachusetts, New Jersey, New York, Oregon, Rhode Island, and Vermont. (see Appendix B) The program requires major manufacturers to provide ZEVs as a certain percentage of all passenger cars and light-duty trucks delivered for sale in those states, reaching 15 percent of all new vehicles sold in 2025.87 Together, these states represent more than a quarter of the U.S. vehicle market.88
The ZEV mandate states had significantly higher market shares of PEVs than non-ZEV-mandate states, collectively reaching 3.65 percent of new vehicle sales in December 2017.89 On average, these states have enacted more policies to promote PEV deployment than non-ZEV mandate states, both in total and of the vehicle-specific ones considered in this report. When excluding California, the ZEV mandate is the best policy for increasing market share in a given state.
Furthermore, adoption of the ZEV mandate could influence regional PEV markets, not just the market within a given state. The average market share of PEVs in ZEV mandate states was 1.06 percent; in states neighboring ZEV states (see Appendix B), the average market share was 0.62 percent; and in all other states, the average market share was 0.35 percent. This relationship is correlational, and other factors—such as charging infrastructure availability and local policies—could drive this trend.
Even though the ZEV mandate is extremely effective at increasing PEV deployment in ZEV states outside California, the benefits are not yet fully realized across the 10 states. If the ZEV mandate states were to meet the 15 percent target by 2025, increasing their respective market shares by the same amount each year, the states should collectively be at about 6.8 percent now. The effect of the ZEV mandate has been reduced outside California because of the so-called travel provision in the ZEV rules, which stipulates that carmakers can earn ZEV credits in every state for a zero-emission vehicle that is sold in any ZEV mandate state.90 The provision has created an incentive to sell BEVs and FCEVs mostly in California, since that is where charging infrastructure and demand have been.91 Therefore, model availability varies widely by state. The Union of Concerned Scientists estimated that, in 2015, California drivers had 22 PEV model options, while no other state had more than 14.92 Six states—all non-ZEV mandate states—had none.93 Starting with the model year 2018, the travel provision was lifted for PEVs.94 Therefore, ZEV mandate states outside California are likely to soon see an increase in model availability and total PEV sales.
Regional Electric Vehicle Plan for the West
Another coalition of states has joined together to promote PEV charging infrastructure. The Regional Electric Vehicle Plan for the West coalition—which comprises Arizona, Colorado, Idaho, Montana, Nevada, New Mexico, Utah, and Wyoming—has set a goal to “make it possible to seamlessly drive an electric vehicle across the Signatory States’ major transportation corridors.”95 Currently, there is no evidence that the PEV market shares of these states are significantly higher than those of states outside the coalition; however, states in this coalition have collaborated and shared best practices, particularly regarding the Volkswagen Mitigation Trust funds.96
High-occupancy vehicle lane access
Free HOV lane access is effective at increasing retail market share of PEVs, but less so outside California. HOV lanes are restricted to vehicles with two—sometimes three—or more passengers. According to the most recent inventory completed, in 2008, 21 states had HOV lanes.97 Of these 21 states, 12 provide free HOV lane access to PEVs in some form. New Jersey, New York, and Virginia were excluded from this analysis because the benefits in these states only apply to some roads. (see Appendix B for more information regarding states included in analysis) Notably, Virginia explicitly excludes some of the most congested roads from the free HOV lane access laws. Nevada did not have any reported HOV lanes in 2008 but now has them near Las Vegas and allows PEVs free access.98
Free HOV lane access was effective at influencing the retail market share of PEVs in states with this policy, but the trends were not as clear when California was excluded from the analysis. This is generally consistent with previous studies of the U.S. PEV market, which have typically found tenuous relationships at best.99 Because HOV lanes tend to be located in large, congested, urban areas, free HOV access is more important to consumers in these areas.100
However, the federal government has plans to phase out free HOV access policies. The most recent surface transportation authorization, the Fixing America’s Surface Transportation Act, allows public authorities to offer free HOV access to HEVs through 2019 only if the vehicles pay a toll. Under the bill, BEVs and PEVs may continue to be granted free or discounted access to HOV lanes through 2025, unless further extended.101
Fleet acquisition requirements
On average, fleet acquisition requirements are not effective at increasing government PEV market share. This report considers states that had a specific target for PEV or ZEV acquisition and/or an alternative fuel or clean fuel vehicle requirement or specific target. All definitions of alternative or clean fuel include electricity, but they also typically include natural gas, biofuel, and others. The author only looked at the five states that had a specific target for PEV or ZEV acquisition. (see Appendix B) Broad fleet acquisition requirements that apply to all alternative fuel or clean fuel vehicles are not generally effective at moving the needle on government PEV market share.
There is also no statistically significant difference between states with specific policies targeted at just PEVs or ZEVs and those without. However, these five states had a much higher average government fleet share of PEVs—1.40 percent—compared with other states and, anecdotally, these policies appear to be effective at encouraging procurement changes. For example, then-Gov. Maggie Hassan (D-NH) signed an executive order in May 2016 requiring the state to “pursu[e] opportunities to procure electric vehicles (EV) [BEVs, according to terms used in this analysis] and plug-in hybrid vehicles for use in the state fleet.”102 Before that executive order was signed, the state had purchased just one PHEV; after, it acquired 7 PHEVs and 18 BEVs.103
State fleet vehicles make up a tiny fraction of all vehicles, but states have far greater control over these than they do private vehicles. In 2016, the Federal Highway Administration reported that there were about 1.4 million state-, county-, and municipal-owned automobiles.104 California had the largest fleet with 231,692 automobiles. Of California’s new government fleet registrations in 2016, just 566—or 3.92 percent—were PEVs.105 Millions of cars are sold in the United States every month. Government fleet vehicles are unlikely to drive an electric vehicle revolution, but they still play an important role in reducing pollution and greenhouse gas emissions and in maximizing the use of taxpayer funds.
Licensing fees
Increasing licensing fees on BEVs does not decrease retail market share of BEVs, and decreasing licensing fees on PEVs does not increase retail market share of PEVs. The Highway Trust Fund supports infrastructure investment for highway projects. It is designed to be a user-supported fund, charging federal gasoline taxes and truck user fees that are then allocated to states via a formula. Beginning in the fiscal year 2008—and in each subsequent fiscal year to date—the Highway Trust Fund’s outlays have exceeded its revenues.106 Some of this decline is due to improving fuel economy and increasing market share of electric vehicles, which use alternative energy sources not captured by the gasoline taxes. Many states have adopted licensing fees for HEVs and PEVs to pay for their shares of infrastructure funds. Other states have further decreased licensing fees in an attempt to make PEVs more attractive to consumers.
This report tests two questions related to licensing fees: One, does increasing licensing fees on BEVs affect retail market share of BEVs? Two, does decreasing licensing fees affect retail market share of PEVs?
Between 2013 and 2017, 15 states charged consumers licensing fees for PEVs; other states have planned future fee increases.107 Many of these 15 states set different prices for PHEVs and BEVs in order to reflect a vehicle’s level of gasoline consumption. Since all states levy fees on BEVs but not necessarily on PHEVs, the report only looks at the effect of higher fees on the retail BEV market. The licensing fees range from $50 in Wyoming to $200 in West Virginia and Georgia. (see Appendix B) There is no appreciable difference in retail BEV market share between states that charge licensing fees and those that do not.
Four states incentivize PEVs by removing licensing fees. The value of this benefit is $18 to $36 per year. (see Appendix B) The analysis found no evidence that this policy is effective in driving PEV adoption in these states. The four states had slightly higher market shares, on average, than the 47 states without such a policy, but the difference was not significant. Furthermore, the sample is likely too low to accurately measure the impacts of this strategy.
Emissions testing fees
Eliminating emissions testing fees for PEVs does little to increase PEV market share. Fourteen states offer emissions testing exemptions for PEVs. On average, across these states, emissions testing costs about $20, and in half the states, testing is only required in certain counties. (see Appendix B) Given the emissions benefits of PEVs, this policy makes sense, though it appears to do little to shift PEV sales.
Closing the knowledge gap
There are no standard or consistent policies across states aimed at closing the knowledge gap regarding PEVs or EVs more broadly. The DOE’s Clean Cities program has awarded millions of dollars for projects across the country that reduce petroleum use in transportation, some of which have gone to states.108 The program has helped nonprofits, academic institutions, and states fund pilot programs for increasing consumer awareness of PEVs. The Florida Department of Agriculture and Consumer Services, for example, received $400,000—which was matched by local funds—to allow thousands of visitors from across the United States to rent a PEV in Orlando.109 Colorado took the DOE funds one step further and institutionalized a program that the state tested through Clean Cities. Colorado’s state-run Refuel Colorado provides a set of technicians and coaches that work with fleets, communities, fuel providers, dealerships, advocacy groups, and others to help identify the monetary savings and other benefits of electric vehicles.110 The program also hosts ride-and-drive events to help familiarize consumers with EVs.
Arizona’s Legislature has made efforts to close the knowledge gap through legislation. As of August 2017, the state requires that motor vehicle dealers make information available on alternative fuel vehicles, such as electric vehicles, and applicable incentives for purchasing or leasing them.111
The International Council on Clean Transportation (ICCT) found that, at the local level, promotional activities can be effective at increasing PEV market share. It documented that, in 2015, 22 of the 50 largest metropolitan areas had PEV informational materials and 30 had held city outreach events.112 Furthermore, PHEV market share was statistically correlated with combined city, state, and utility promotional activities in the metropolitan areas tested.113 Given the lack of statewide applicability and consistency among state-level policies for increasing consumer awareness, the author of this report did not empirically test the effectiveness of such policies. However, given the proven success at the local level, policies like this could be effective at increasing PEV market share and should be studied further as new policies are tested.
Conclusion
The public benefits of electric vehicles are clear; they have been proven to improve air quality and reduce greenhouse gas emissions. Yet plug-in electric vehicles currently comprise approximately just 1 percent of new vehicle registrations, which translates to an even smaller proportion of total vehicles on the road.114 The market is not yet large enough to see benefits on the scale necessary to solve key environmental and public health challenges, such as reducing U.S. transportation emissions. Policy can help address issues that currently inhibit PEV deployment, such as cost, range, model availability, and knowledge of PEVs.
Federal-level policies and initiatives have laid the foundation for strong action. These include tax credits; the DOE’s Clean Cities program and Workplace Charging Challenge; and investment in research and development. Norway and China have demonstrated that strong leadership and action at the national level is needed for an economywide change. Particularly effective are policies that lower the cost of PEVs below their ICE vehicle competitors in order to reflect the environmental benefits of electric vehicles.
While not discussed substantially in this report, local-level action is an important complement to state and federal policies. In 2015, 82 percent of new PEVs were registered in the 50 most populous metropolitan areas.115 Local trends and policies are clearly driving PEV uptake within states, as California does for the United States at large. The ICCT provides more discussion of what policies accelerate PEV deployment at the local level.116
This report quantitatively assesses the ability of state-level policies to influence PEV market share. Although the author focuses on policies targeted at vehicles rather than charging infrastructure, she found that financial incentives for charging infrastructure are very effective at influencing the share of vehicles on the road in a given state. This was true regardless of whether California was included in the analysis. Many states have a combination of policies; of the policy types tested, 29 states had at least two. Individual states have also tested a wide variety of other unique policies to address barriers to PEV deployment. For example, Hawaii’s Senate mandated rules encouraging the use of high-efficiency vehicles, including PEVs, for taxis at Honolulu International Airport.117
As states take an increasing leadership role in the PEV policy space, they should consider what policies and combinations of policies are effective at putting more PEVs on their roads. Building on this analysis, a future report will provide recommendations for increasing state-level ambition for PEV policy action.
Appendix A: Methodology
This analysis was similar in design to Sydney Vergis and Belinda Chen’s study on state-level policies and general trends as well as Nic Lutsey, Peter Slowik, and Lingzhi Jin’s report on local-level policies.118 Policies were measured using two-sample, one-tailed t-tests, which assumed unequal variances, in order to compare the relevant market shares of groups of states with and without the policy in question. Market shares used were for all vehicles, government fleet vehicles, and retail vehicle sales. Depending on whether the policy would be relevant to that market, different market share segments were used. For example, a government fleet vehicle requirement would not necessarily influence the overall market but could affect the share of government vehicles.
Importantly, the date of policy introduction is not considered in this analysis; states were considered to have a policy if there was a policy in effect at any point during the study period of 2013 to 2017.
The author ranked policies’ effectiveness by the p-value from the t-test, which shows the probability that market share in a state with a given policy is greater than in a state without that policy. This analysis found there to be a significant difference when the one-tailed p-value was greater than 0.05.
Market share data are from the Alliance of Automobile Manufacturers and reflect new vehicle registrations in each state from 2013 to 2017.119 For each test, the state policies are detailed in Appendix B.
Appendix B: State policies by type
Financial incentives for charging infrastructure
The author considered states with financial incentives in the form of government-funded grants, tax credits, or rebates that can be used for public or private charging infrastructure. Other financial benefits are available in these states and in others, though funding is less direct or the state has less control. Nebraska, Ohio, Oregon, and Utah, for example, all offer loans for charging infrastructure. Many utilities offer charging infrastructure incentives specific to their service areas.
The author used Department of Energy (DOE) data to calculate the number of charging outlets per capita in each state and then tested the effectiveness of financial incentives at influencing this number.120 Level 2 and DC fast chargers were included since many Level 1 chargers are residential and not reported on the DOE website. Furthermore, only non-Tesla DC fast chargers were included since Tesla’s fast chargers are proprietary and only useable by Tesla vehicles. Population was calculated as an average of the population in each state from 2013 to 2017, the years of this analysis, using U.S. Census Bureau data.121 Per capita chargers are significantly higher in states with financial incentives for charging infrastructure: Including California, the p-value is 0.013; excluding California, the p-value is 0.025. (For more information, see Table 5 in PDF version of report)
Financial incentives for vehicles
Some states had additional financial incentives that will be launched in 2018—such as Pennsylvania, Oregon, and Texas. Others had incentives that are only for conversion of existing ICE vehicles, such as the District of Columbia and Montana; or are loan-based, such as Oklahoma.122 These states were not included in the analysis. (For more information, see Table 6 in PDF version of report)
Zero-emission vehicle mandate
California, Connecticut, Massachusetts, Maryland, Maine, New Jersey, New York, Oregon, Rhode Island, and Vermont are ZEV mandate states.123
Arizona, the District of Columbia, Delaware, Idaho, New Hampshire, Nevada, Pennsylvania, Virginia, Washington, and West Virginia neighbor ZEV mandate states.
High-occupancy vehicle lane access
Arizona, California, Florida, Georgia, Hawaii, Maryland, North Carolina, Nevada, Tennessee, and Utah allow—or allowed during the study period—free access to PEVs on all HOV lanes in the state.
Fleet acquisition requirements
(See Table 7 in PDF version of report)
Licensing fees
(See Tables 8 and 9 in PDF version of report)
Emissions testing fees
(See Table 10 in PDF version of report)
About the author
Lia Cattaneo is a research associate for Energy and Environment Policy at the Center for American Progress.
Acknowledgments
The author would like to thank Luke Bassett, Alison Cassady, Kristina Costa, Patrick Dolan, Michael Madowitz, and Danielle Schultz for their contributions. This report was also improved with input from many partners in federal, state, and local governments, as well as others in the public and private sectors.