To see an updated version of this report, covering all 50 states, please click here.
This report contains a correction.
Click here to view the full-size version of the interactive in this report.
Introduction and summary
On a Saturday in August 2016, Samantha Harmon received a shocking email. Her son Nathan’s child care center would close permanently, effective on Monday. Without backup care, Samantha immediately took off work to try to find another child care provider.1 The Harmons live in a middle-class suburb of Rochester, New York, where licensed child care is hard to find. Local news station WHAM interviewed the Harmons and other parents whose children attended the Creative Kidz Child Care Center. These parents described themselves as being in panic mode while they scrambled to arrange backup care, and they had good reason to worry. Like 60 percent of New Yorkers, they live in a child care desert with a severe undersupply of licensed child care.
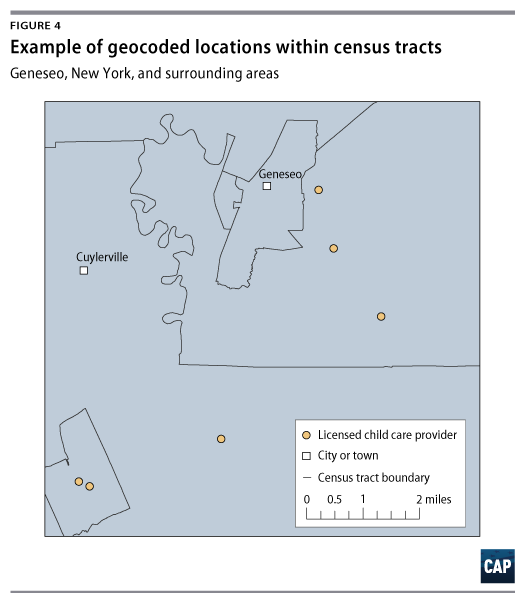
Fifty miles to the south, in Livingston County, New York, licensed child care is even sparser. The area is largely rural, with small towns and cities scattered among rolling hills and farmland. Many families only have one or two licensed child care providers from which to choose—if they are fortunate. In the Livingston County seat of Geneseo, a city of roughly 10,000 residents, there are only three licensed child care providers, with a combined capacity to care for fewer than 75 children. In areas such as these, parents are forced to make difficult decisions that might include finding unlicensed child care, leaving the workforce, or patching together a network of family and friends. For many families, these options are not ideal for children or for parents.
The effects of this undersupply have shown up in several nationally representative surveys of parents. In 2015, a national poll conducted by The Washington Post found that more than three-quarters of mothers and half of fathers had passed up work opportunities, switched jobs, or quit their job due to a lack of paid leave or child care.2 Last year, a study by NPR, the Robert Wood Johnson Foundation, and the Harvard T.H. Chan School of Public Health found that roughly two-thirds of parents said they had “only one” or “just a few” realistic child care options.3
Over the past few decades, the percentage of families in which all parents work outside the home has increased dramatically.4 During the same period, a growing body of research has assessed and affirmed the role of early care and education in shaping children’s educational, health, and social outcomes.5 In most markets, these coinciding factors should produce a thriving market for quality child care. Certain places—usually affluent suburbs—have indeed seen supply rise to meet demand. As this study finds, however, many neighborhoods, small towns, and rural communities across the country have inadequate child care options.
This report analyzes the locations of licensed child care providers in 22 states—covering two-thirds of the U.S. population—and finds that approximately half of Americans live in “child care deserts.” This term, adopted recently by the Center for American Progress and Child Care Aware of America, is taken from terminology used to discuss the problem of “food deserts.” In this report, the authors describe child care deserts as areas with little or no access to quality child care.6 (see Figure 1)
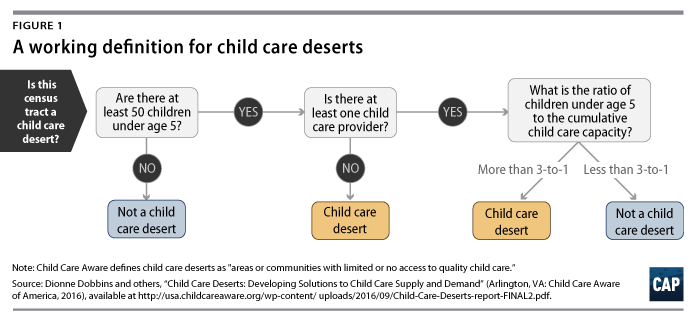
Specifically, this analysis defines child care deserts as neighborhoods or communities that are either lacking any child care options or have so few child care providers that there are more than three children for every licensed child care slot.7 According to research published by the U.S. Census Bureau, one-third of children under age 5 are regularly in nonrelative care;8 therefore, in places where there are more than three children for every child care slot, there may be child care waiting lists, unlicensed child care arrangements, or effects on parents’ employment decisions.
Key findings in this report include:
- More than half of the population across the 22 states studied—51 percent—live in neighborhoods classified as child care deserts.
- Fifty-eight percent of rural tracts qualify as child care deserts, while only 44 percent of suburban neighborhoods fit the definition. Urban areas where the median family income is below average also have high rates of child care deserts.
- Hispanic/Latino and American Indian and Alaska Native (AIAN) communities are disproportionately represented in child care deserts, with roughly 60 percent of their combined populations living in areas with a low supply of child care. More than 75 percent of the rural AIAN population lives in a child care desert.
- Child care deserts have, on average, maternal labor force participation rates 3 percentage points lower than communities where there is adequate child care supply. In communities where median family incomes are below the national average, this maternal employment gap is even wider.
Choosing a child care program is a complex decision for families. Factors such as cost, location, operating schedule, and personal preferences influence child care choices.
Factors such as cost, location, operating schedule, and personal preferences influence child care choices.
A rich body of research documents the high cost of child care and the barrier that cost presents for most families, but supply issues are not as well-understood.9 Previous research suggests that the location of child care programs is especially salient for low-income parents, who may rely on public transportation or have limited job flexibility.10 This report provides a tool for analyzing child care supply across 22 states and sheds light on some of the most important characteristics associated with low child care supply. These data provide only a snapshot of child care shortages, not a complete picture of child care supply and demand in every community. Thus, this analysis is not designed to understand the directionality of the relationship between supply and demand. However, understanding proximity to licensed child care is an important component of child care access and can be used as a springboard for policy solutions that help families find high-quality child care that meets their needs.
This report also proposes policy recommendations designed to address the scarcity of high-quality child care providers. Child care is an essential part of employment infrastructure; as with roads and bridges, parents require child care to get to work. By investing in child care infrastructure as much as it does in bridges and roads, the federal government can support economic growth and family economic security.
![A man walks through an economically distressed section of Worcester, Massachusetts, on March 20, 2018. (Getty/Spencer Platt)]()

Take Action: 12 Solutions to Cut Poverty
Findings
CAP collected and analyzed data on the location and capacity of the licensed or registered child care providers in 22 states (see Methodology text box and Appendix for further specifics about the analysis). The study found that 51 percent of people live in child care deserts.51%
of people live in child care deserts
Click here to view the full-size version of this interactive.
Rural areas with below-average incomes are most frequently child care deserts
Each community in this study is assigned to one of three urbanicity types—rural, suburban, or urban—based on a measure of household density, which takes into account the number of occupied households per square mile.11 Using this measure, about 20 percent of the population is categorized as rural; 25 percent lives in high-density urban neighborhoods; and 55 percent resides in suburban, medium-density neighborhoods. The estimate of the rural population is in line with other estimates of the proportion of Americans living in rural areas, including that of the U.S. Census Bureau.12
Overall, rural census tracts are the most likely to be classified as child care deserts, with 58 percent of rural communities meeting that definition. Even with the inclusion of family child care providers, there is a vast undersupply of child care infrastructure in rural areas, despite the fact that home-based child care is the most common child care setting in rural areas.13 Since many family child care homes are only licensed to serve between six and 12 children, an area may contain several small providers while still qualifying as a child care desert.14
Urban neighborhoods are also more likely to be child care deserts than not, with about 55 percent of urban census tracts showing child care supply gaps. While suburban neighborhoods are relatively less likely to be child care deserts, more than 40 percent of suburban families find themselves in neighborhoods with too few child care options, and waiting lists can still be common, especially for infant and toddler care.
Read more
When the analysis breaks down these urbanicity categories by whether the typical family in a tract falls above or below the median family income nationwide, a more nuanced picture emerges. (see Figure 3) Using these subcategories, nearly two-thirds of rural communities with median family incomes below the national average are child care deserts. Notably, urban areas with below-average incomes have the second-highest rate of child care deserts, exceeding the rate of rural areas with above-average incomes. As shown in Figure 3, higher-income neighborhoods fare better within each category, and suburban tracts with median family incomes above the national average are the least likely to be child care deserts.
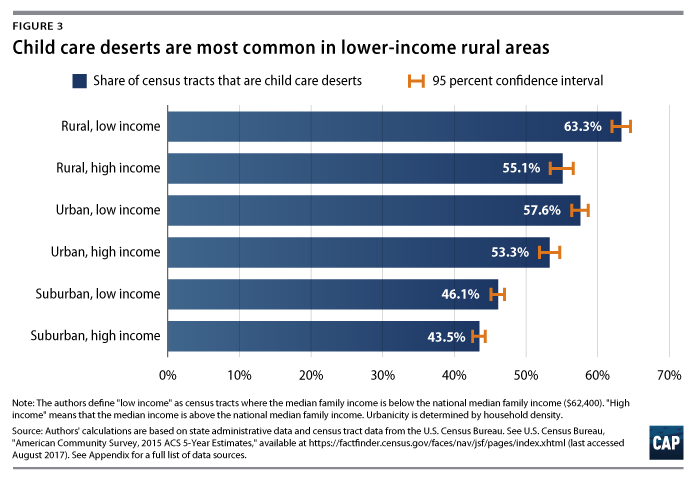
These trends may reflect imperfections in the child care market, from capital market constraints for lower-income parents to the fact that education carries high fixed costs, which may be prohibitive in small or rural communities. While further research is needed to understand child care supply fully, these findings suggest that low-income children are less likely to be in geographic proximity to licensed child care, which could inhibit the ability to access it.
Methodology
CAP collected data on the location and licensed capacity of nearly 150,000 licensed or registered child care providers from 22 states. The authors included all child care centers; family child care providers; Head Start providers; and public and private preschools in these states in order to get a full picture of the supply of licensed child care options available to nearby communities.
Each child care provider was geocoded based on the physical address provided on their license, giving the authors a precise latitude and longitude for every provider. In cases where the precise address was not available, the authors used the ZIP code to approximate the address. The authors then grouped providers by census tract and added up the total licensed capacity of the locations in each tract. This information was merged with a variety of census estimates on population demographics, population density, family income, poverty, and maternal labor force participation, among other variables. All data are publicly available, and a list of data sources and census variables can be found in the Appendix.
Using this original dataset, the authors applied the child care deserts definition to thousands of census tracts, a geographic unit sometimes used by city planners to approximate neighborhoods.15 Census tracts generally have a population size of between 1,200 and 8,000 people, with most tracts housing around 4,000 people. These geographic units usually cover a contiguous area, and their boundaries commonly follow identifiable features.16
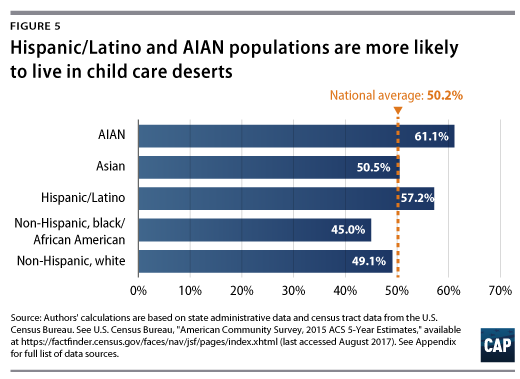
The child care market underserves Hispanic/Latino and AIAN communities
Using geographic estimates of population by race and ethnicity, this study estimates the proportion of different racial and ethnic groups living in child care deserts. The data show that Hispanic/Latino and AIAN populations are vastly overrepresented in child care deserts.17 As seen in Figure 5, the group with the smallest proportion residing in child care deserts is black Americans or African Americans, while non-Hispanic white Americans and Asian Americans hover right around the overall total of the population living in child care deserts in the 22 states. It is important to note, however, that proximity to licensed child care does not mean that people have access to programs. Families across each racial and ethnic group face economic barriers such as high costs, low wages, and historic disenfranchisement.18
This analysis cannot determine the relationship between child care supply and demand, but supply is certainly one factor that should be considered in any child care policy. Evidence of differing levels of supply, depending on the racial and ethnic composition of a neighborhood, may not be purely a function of different communities’ demand or need for quality child care.
Hispanics/Latinos are the fastest growing racial/ethnic group in the United States, yet these families are more likely to live in areas with fewer child care options. Currently, one-quarter of all children in the United States are Hispanic/Latino, and they are projected to constitute one-third of the child population by 2050.19 Any structural changes to the supply of child care in America will need to remedy the fact that child care seems to be consistently harder to find in communities with a high concentration of Hispanics/Latinos.
For many years, child care researchers and advocates have speculated about whether Hispanic/Latino families may exhibit a cultural preference for informal or relative care over formal or nonrelative child care arrangements. A series of recent studies by researchers at the National Research Center on Hispanic Children and Families investigated many of these assumptions, finding that Hispanic/Latino parents’ perceptions of different types of child care arrangements are generally similar to those of black Americans or African American and white non-Hispanic parents. Using data from the 2012 National Survey of Early Care and Education, these researchers found very little difference between Hispanic/Latino children’s participation in early care and education and that of children from other racial/ethnic groups between ages 3 and 5.20 They also found that Hispanic/Latino parents generally have the same perceptions of center-based care as other racial/ethnic groups and even perceive relative care as less favorable than do non-Hispanic white parents.21
However, among children younger than age 3 in low-income families, the researchers did find significant differences in rates of participation in early care and education programs between immigrant and nonimmigrant Hispanic/Latino households.22 They also found that Hispanic/Latino households are more likely to need care during nonstandard hours and are more likely to have a grandparent or teen living in the household.23 These findings suggest that Hispanic/Latino families have diverse child care needs and preferences, and they speak to the need for caution in assuming that Hispanic/Latino families do not need or want licensed child care. They also suggest that higher rates of child care deserts in Hispanic/Latino communities should not be attributed entirely to lack of demand.
In this study, the AIAN population is predominantly located in low-density rural areas, making its members less likely to have proximate child care options. The census estimates used in this study included only those people who identify as AIAN alone, which may undercount that population. Further research will depend on more and better data, which is a chronic problem in tribal social service provision. The poverty rate for AIAN families with children under age 5 is estimated to be 74 percent higher than the rate for the rest of the U.S. population, underscoring the deep need for high-quality child care in these communities.24
It is unclear whether child care supply is lower in Hispanic/Latino and AIAN communities because there is less demand or whether reduced demand stems from a sustained lack of supply. Additionally, there may be sizeable differences in attitudes and child care preferences by generational cohort, resulting in a child care market that has been slow to recognize a considerable, emerging client base. This issue warrants further study, both qualitatively and quantitatively.
Child care deserts are associated with lower rates of maternal labor force participation
From a public policy standpoint, improved access to consistent and affordable high-quality early care and education accomplishes two important objectives: In addition to promoting healthy child development, these programs enable parents to continue working or to re-enter the workforce. This is especially true for women, as mothers traditionally spend more time on caregiving than fathers do and are more likely to leave the labor force to care for children.25
In addition to looking at racial and ethnic patterns of child care availability, this study examines the relationship between child care deserts and parental labor force participation. The labor force participation rate is a measure that describes the proportion of adults who are either currently employed or actively looking for work. Using local estimates of labor force participation by gender and parental status from the U.S. Census Bureau, and weighting the estimates by the population of parents in each census tract, this analysis compares parental labor force participation between child care deserts and nondeserts.
This report finds that child care deserts are associated with maternal labor force participation rates that are 3 percentage points lower than those in neighborhoods with greater child care supply. As shown in Figure 6, this difference is not observed in male labor force participation rates. It is most pronounced among mothers with children under age 6—in other words, mothers with children for whom quality child care could potentially affect their ability to work.26 When the sample is restricted to census tracts for which the median family income is lower than the national average, this labor force participation gap becomes even more pronounced. Among these lower-income areas, child care deserts are associated with maternal labor force participation rates that are nearly 5 percentage points lower than in nondeserts.
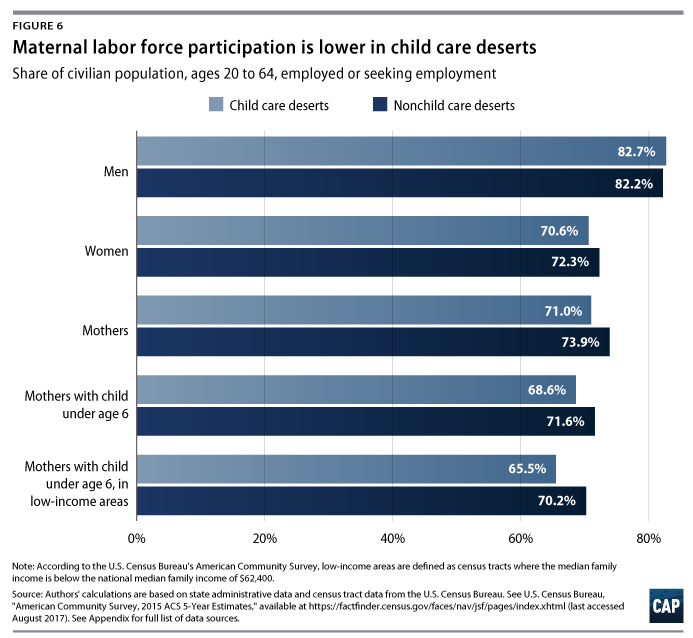
These associations are statistically significant, but they should not be interpreted as evidence of a one-way, direct causal relationship. As previously stated, this analysis cannot disentangle the complicated relationship between child care demand and supply. For example, it may be that child care providers are not attracted to regions where mothers are less inclined to work outside the home while their children are younger than school age.
Nevertheless, previous research literature suggests a linkage between the availability of child care and maternal labor force participation, indicating that a reduction in the cost of child care or the availability of public options may lead to an increase in maternal employment.27 Researchers have also found evidence that expanding full-day kindergarten increases the likelihood that mothers will work full time.28
The impact of child care supply alone is not well-understood, but these findings suggest a need for more research to examine how local availability of child care slots may interact with parents’ decisions on when to return to work after the birth or adoption of a child and how many hours they work. Increasing labor force participation is often a goal of policymakers who seek to improve family economic security and promote equal opportunities for women. These initial findings suggest that improving child care supply may be part of a larger effort to improve access to child care for working families.
Policy recommendations
Experts have shown in study after study that high-quality early care and education produce external benefits that are abundant and long-lasting.29 Quality child care may be costly, but many of its associated benefits spill over into society over time, reducing inequality in educational, health, and social outcomes. Yet while parents’ private child care spending serves the public good, the government invests relatively little in subsidies to encourage such spending.30
Working families across the country deserve more quality choices when it comes to child care. Early childhood researchers, parents of young children, and child care providers have acknowledged the important role that quality child care plays in a child’s development. Without a healthy marketplace of child care options, however, many families must make compromises, either in their ability to work or in their children’s early education.
Working families across the country deserve more quality choices when it comes to child care.
First, the federal government must make a substantial and sustained investment that helps low-income and middle-class working families afford child care. Until families have the resources to afford child care, the market will be driven by parents’ ability to pay, leaving communities of color and those living in rural areas behind. Several organizations, including CAP, have put forward proposals that would limit the amount that families pay for child care, improve child care quality, and provide resources to support a professional and effective workforce.31
In addition, the federal government should specifically invest in child care and early education infrastructure just as it invests in public safety, public parks, and public schools. This report questions whether the market for child care can naturally and efficiently allocate quality early care and education. That is why CAP has previously called for a child care infrastructure investment that provides resources to states, tribes, and communities to address child care deserts.32 A child care infrastructure investment should support construction and renovation of early childhood facilities; help build a professional and effective workforce; and provide resources to support licensed child care providers.
While this study begins to demonstrate the undersupply of child care in the United States, additional research is needed to understand and address the issue fully. For example, future research should seek to better understand cultural preferences of racial and ethnic groups and families with nontraditional schedules so that policy solutions can adequately meet the needs of diverse families.
In addition, future research should examine the relationship between workforce participation and child care supply. Incentivizing employment is often a goal for policymakers who seek to improve economic security for families. However, the lack of affordable and accessible child care is too often a barrier for families. A better understanding of the role of child care supply would help inform policy solutions.
Conclusion
In the case of the stranded Rochester families whose child care center abruptly closed in 2016, a desperate situation was followed by an unusual solution. One of the families decided to buy Creative Kidz Child Care, renovating and investing in the center before reopening nine months later, with many of the same employees and children.33 With few other options in the area, these parents chose to invest directly in their community—not for personal profit, but rather for the educational and social impact that high-quality child care provides. As admirable as that may be, however, it is not a long-term or replicable solution to expanding access to high-quality, affordable child care.
When analyzed on the scale of the American economy, the difficult choices that families are forced to make for their young children add up to sizeable economic effects. In recent remarks at Brown University, Federal Reserve Board Chair Janet Yellen noted that raising the female labor participation rate to that of men could raise the U.S. gross domestic product by 5 percent—which amounts to nearly $1 trillion in economic production.34 Yellen pointed out that while the United States used to lead most other industrialized nations in female labor force participation, it has recently fallen to 17th place out of 22 advanced economies.35
One of the major differences between countries with growing female labor force participation and the United States is that many of these countries adopted policies to improve the availability of child care.36 The United States will undergo many changes in the coming years as the population ages and as children of color become a larger portion of the U.S. population. The country will also need to take steps to reduce the growing economic inequality that has made some people in rural areas and small towns feel left behind as jobs move overseas and automatization replaces workers. It is important for leaders and policymakers to consider how the supply of child care can help grow the economy and support a more diverse America. An investment in the infrastructure of child care supply would be an excellent place to start.
Appendix: Methodology, data sources, and limitations
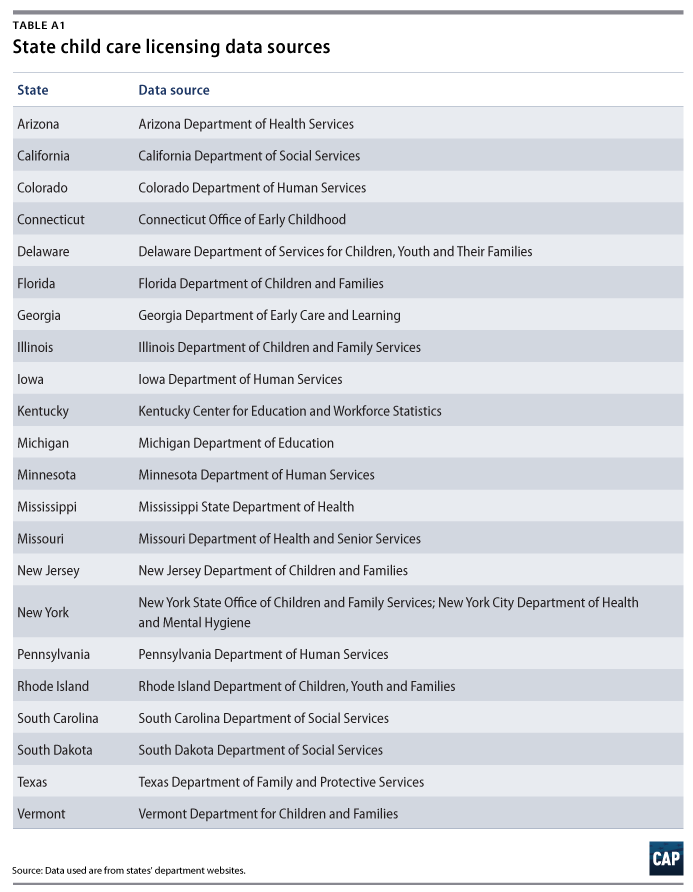
The authors collected data on the location and maximum capacity of all licensed or registered child care providers in 22 states. (see Table A1 for data sources) This includes child care centers; family child care providers; Head Start and Early Head Start providers; and pre-K classes. The 22 states that have been included in the study publish fully downloadable tables of their licensing databases on a government website, usually within a department of human services or child and family services. The states not included in this study were excluded because they do not make their complete child care licensing databases downloadable or because they do not have a searchable online child care licensing database.
Once this information was collected, the authors cleaned the data to remove any duplicates and child care providers whose licenses had expired or been suspended. All summer camps or after-school care providers were excluded, because this study looks at the supply of child care for children from birth to age 5, except in cases where child care providers also offered after-school capacity. In these cases, the number of school-age children was deducted from the overall capacity of the child care location. In total, this analysis included roughly 145,000 child care locations, with a combined total capacity of approximately 6.2 million child care slots.
Next, the authors used geocoding software to convert the location data from street addresses to precise latitude and longitude coordinates. These coordinates were then plotted, retaining their associated licensed capacity data, using Esri ArcGIS software. Using TIGER/Line shapefiles downloaded from the U.S. Census Bureau, these locations were spatially joined to the surrounding census tract in ArcGIS. This resulted in a dataset with a count of child care locations and a sum of capacity for each census tract in the 22 states studied. In total, the analysis included 46,532 census tracts.
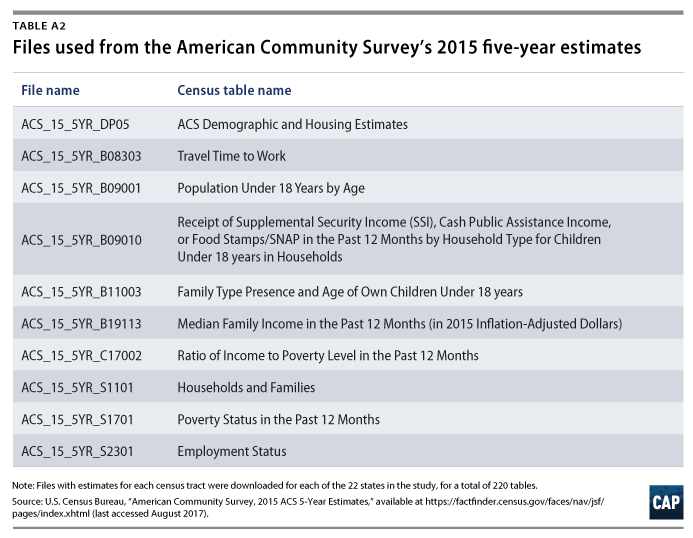
This dataset of child care locations and capacity, by census tract, was then merged with variables from 10 census tables, all of which are listed in Table A2. Not all variables listed were used in the analysis, but they are presented here nonetheless. Once these variables were merged with the counts of child care locations and capacity, the authors generated a binary variable to identify child care deserts using CAP’s working definition for child care deserts, as shown in Figure 1. For all statements of statistical significance, a significance level of p < 0.05 was used, unless otherwise noted.
One of the goals of this research was to analyze whether rural, suburban, or urban areas have differing levels of child care supply. Since, to a certain extent, these categories are a subjective evaluation, this question poses a formidable challenge. Inspired by research by economist Jed Kolko, this study uses household density—that is, the number of occupied households per square mile—to categorize each census tract as rural, suburban, or urban.37 The results were analyzed by mapping the resulting dataset in ArcGIS.
This study has some limitations, largely related to the assumptions that are used to define child care deserts. As with any complex analysis, the underlying assumptions will not suit every scenario. This analysis, and the working definition of a child care desert, assumes that families prefer child care that is closer to their home. While this may be true for many, or even most, families, some child care arrangements work better when they are closer to a parent’s employer or school. Besides location, there are other factors that figure into a child care decision that this analysis cannot fully model. For instance, child care is often driven by hours of need or a child’s age. While, in the aggregate, this study may accurately estimate the overall undersupply of licensed child care, the problem is likely worse for those seeking child care during nonstandard hours, including weekends and evenings.38
Some of the analysis’ limitations result from incomplete data. While the authors were able to collect a large amount of data from 22 states, this report does not cover the entire U.S. child care market. More data may show that the overall problem is worse or better than currently estimated. Additionally, a few state databases do not include complete data, requiring some imputation on the part of the authors. California does not publish the complete addresses of large family child care providers, though it does list their ZIP codes. These large family child care providers could therefore not be geocoded and placed into census tracts. Instead, these providers were probabilistically assigned to a census tract within their ZIP code, using the share of the ZIP code contained within that tract to determine the probability that the provider would be placed there. Additionally, California does not release any public record of small family child care providers. As a result, this analysis does not include small family child care providers in California. Including these providers in the analysis could affect the number of child care deserts in that state.* In Pennsylvania, South Carolina, and South Dakota, some portion of child care providers did not report their full licensed capacity. In these cases, the authors imputed the maximum licensed capacity for that type of child care provider.
About the authors
Rasheed Malik is a policy analyst for Early Childhood Policy at the Center for American Progress, where he focuses on child care infrastructure and supply, the economic benefits of child care, and the disparate impacts of early childhood policy. Malik received his Master of Public Policy from the Gerald R. Ford School of Public Policy at the University of Michigan. Prior to graduate school, Malik was a government affairs and communications associate for the Waterfront Alliance, an organization with the goal of making the New York Harbor a shared, resilient, and accessible resource for all New Yorkers.
Katie Hamm is the vice president of Early Childhood Policy at the Center. Prior to joining the Center, Hamm worked as a program examiner at the Office of Management and Budget on federal child care and early education programs, including the Race to the Top–Early Learning Challenge, the Child Care and Development Fund, and the Head Start program. Her work focused on developing budget proposals to strengthen the quality of and access to early childhood programs. She also worked on international issues in early childhood while on detail to the Organisation for Economic Co-operation and Development. Earlier in her career, Hamm worked at the Center for Law and Social Policy and the Institute for Women’s Policy Research on child care and early education issues.
Acknowledgments
The authors wish to thank Taryn Morrissey, Kate Bahn, and Erik Stegman for their helpful insights and careful review. In addition, the authors would like to thank Rob Griffin, Nicole Svajlenka, Leila Schochet, and CJ Libassi for help with background research and the development of methodologies critical to this report.
*Correction, September 20, 2017: The appendix of this report has been updated to provide more detailed information regarding the number of California’s child care providers.